AMZN TSLA Uptrend or Downtrend
Can you tell if a stock is still in an uptrend after it pulls back or has it reversed to a downtrend? If you can know the difference between the two, your trading results would be greatly improved.
AbleTrend blue Xs and red Xs which are support and resistance can help you to distinguish the two specifically. See today’s charts below.
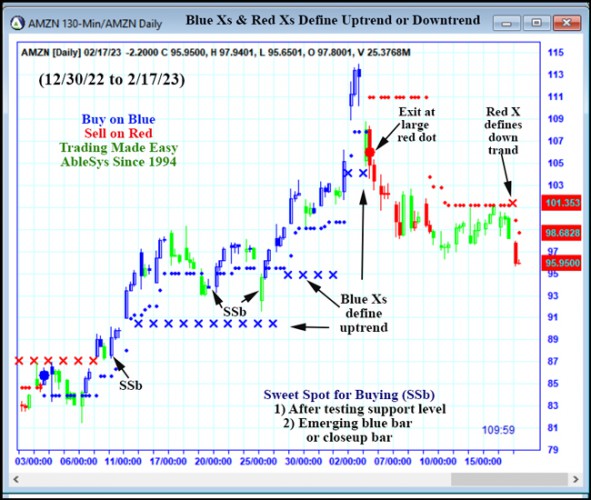
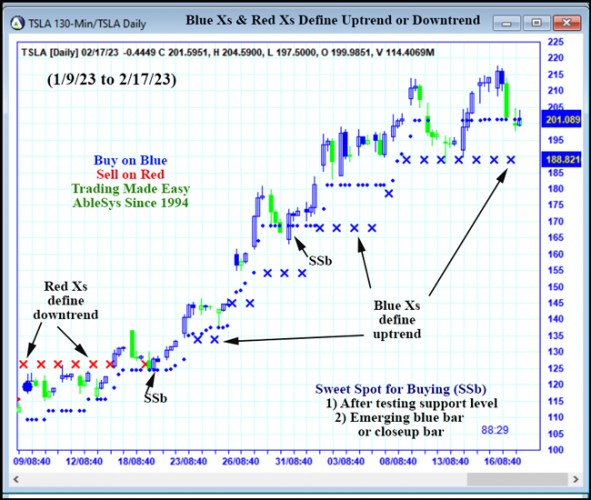
General rules are blue Xs define uptrend and red Xs define downtrend. Once AbleTrend defines the trend-change signals (see TSLA chart 2/15/23) buy at the sweet spot SSb at any dip till a large red dot show up.
Imagine how much money can be saved and how big potential profits can be made with less guesswork when you have AbleTrend at your fingertips!
Be able to define the trend-change specifically is incredible, providing the support levels for your pyramid is more beneficial to gain greater potential profits.
AbleTrend gives one more crucial benefit, that’s risk control. Large red dot is your exit signal.
AbleTrend reflects all the information about the market in the price action.
Make rational trading decisions based on the purest, most accurate signal in the world: Price!
Using AbleTrend is one of the easiest and most accurate ways to make logical trading decisions, based on the purest market data known: price movements.
When you have the easy to read AbleTrend signals at your fingertips, you don’t need to listen to news and commentaries about so called inside stories.
AbleTrend reflects all the information about the market in the price action. Then, nobody can fool you.
Join us for Live Analysis & Education
Join us Tuesdays and Thursdays at 5pm ET (2pm PT)
Ron Carbone -Veteran Trader & Educator at AbleSys will go over the latest AbleTrend trades on the chart: Click here to sign up
You can also view the latest recordings on demand by accessing the webinar archive
Leave a Reply
You must be logged in to post a comment.