How to trade GME and AMC with AbleTrend signals
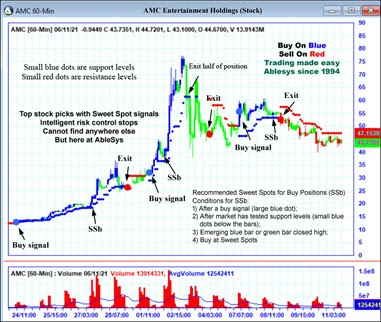
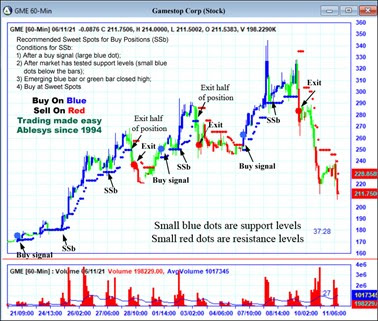
AMC could soar 770%, BB 260% and GME 200% in a week, then gave back in just a few days. High flyers are very volatile. Is there a way to trade these kinds of stocks with some safety measure? Yes, that’s to trade with AbleTrend. Here are the recent charts for AMC and GME with AbleTrend signals on it.
Blue Xs indicate a weekly up trend
Red Xs indicate a weekly down trend
The best setups are when prices are near the small dots because we will know whether we are right or wrong very quickly. If you know when and where to exit you will then have the freedom to enter the market at sweet spots.
If you don’t know the true market support levels…then fear will drive you out of market when you should stay, or you will stay in the market too long with losing positions. AbleSys blue dot and blue x are clearly showing on your chart, if you can read the chart you could do better than most fund managers and save a bundle in service fees.
Tracing Back the AbleTrend Earlier Signals
When checking through the AbleSys Top Stock Picks, you can now trace back the AbleSys earlier signals by click the links below each chart. You may also go to Chart Library to search all the historical posting for the symbols. You can not find this kind of resource for finding the best stocks anywhere else, but here at AbleSys.
Leave a Reply
You must be logged in to post a comment.