How to Trade Current Market Trends?
February 19 all three major indices, the Dow, S&P 500 and Nasdaq, all made historical highs. After the following two weeks, they all drooped off near 15%, then this week is a wide swing, the Dow was up 1,300 points in one day, then dropped near 1,000 points next day etc.. Huge profits could be made if we clearly see the market direction. We have to focus on the big picture first, then use short time interval charts to trade accordingly.
Trading is hard if you know too much and form your own opinions what the market should go. Markets have their own internal forces to decide which direction the trend will go, and never listen to or be affected by someone’s opinions. If we can follow the market trend, then trading made easier.
What AbleTrend indicators tell about current stock market? Let’s take look the following 120-min chart of S&P 500 index ($SPX). It shows the buy/sell signals and key levels of last 3 months. Keep this big picture in mind, trading becomes easier. On the right side, the BUY signal was showed yesterday, and it tells us the short term uptrend was formed. Don’t be panic. Since the market is now below key support level 3,054, let’s wait the market comes back and then take the buy signal. Of course if the market takes off the low, then the uptrend will stop. From the charts we can see the market trends clearly, and it’s easy to follow. Keep distance to the daily market turmoil, and our mind would be calm, our eyes clear, and we simply follow what the market is telling us.
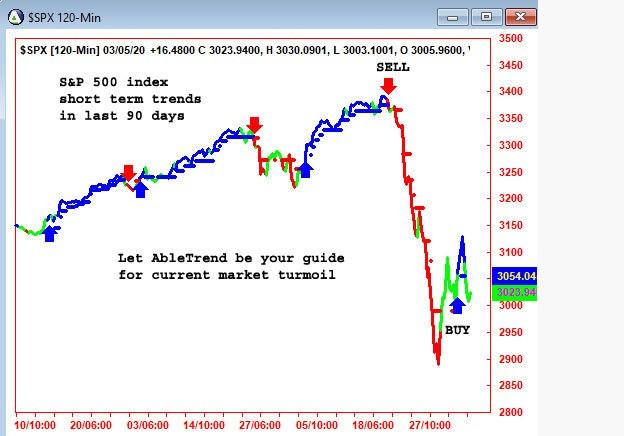
Let AbleTrend be your guide!
Give AbleTrend a trial with hands-holding one-on-one consultant today.
Leave a Reply
You must be logged in to post a comment.