How to Trade Recent Volatility
Since the spread of the coronavirus in China causes prolonged demand disruption. China is the global second largest GDP country and the world’s biggest exporter with $2.5T a year, following by the US $1.7T and Germany $1.6T in 2018. This is why recent market volatility soaring up from around 12 to 18. We saw Dow Jones index dropped near 700 points last Friday and up 480 points today.
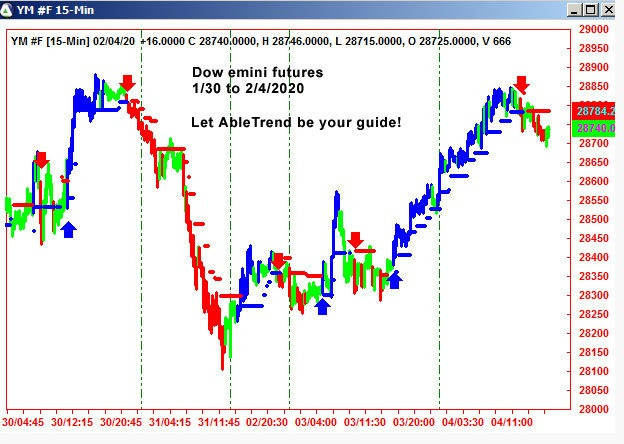
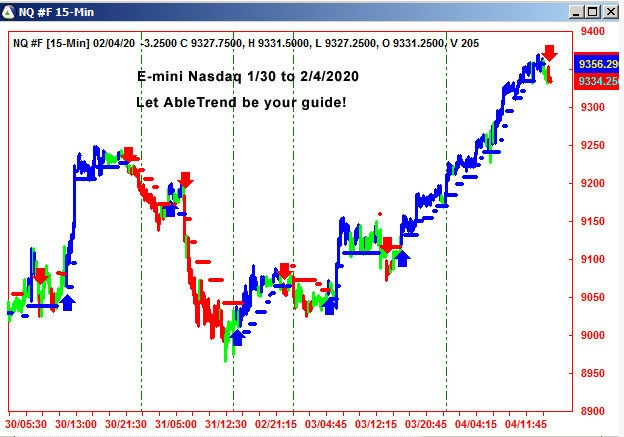
Many traders ask how to trade recent volatile markets? For such market turmoil you must follow a trading strategy system, not guided by chaos news. Following are two charts – YM and NQ swing trading signals of last 6 days, specific buy and sell signals with support/resistance levels.
In celebration of AbleSys’ 26 years of excellence in the trading software industry, we have released a Free 4-part mini-course for serious traders, The Blueprint for Day Trading Success.
And celebration is in order! Only AbleTrend has won Stocks & Commodities magazine Readers’ Choice Awards of triple* trading systems for 24 years in a row (1997 – 2020).
*including stock trading systems, futures trading systems & option trading systems
In this mini-course you will learn:
1. How to define the onset of a real trend so you can make an early entry
2. How to manage trading risk effectively
3. How to identify choppiness using the AbleSys Guidance Chart
4. How to spot low risk entries by identifying Sweet Spots
Put the power of AbleTrend behind your trading. Sign up for your Free mini-course here
Leave a Reply
You must be logged in to post a comment.