Introducing AbleTrend Performance Portfolio (APP) Series (4)
Define the Sweet Spot Entry with AbleTrend
AbleTrend uses the Weekly Support (The Longer Time Frame) as Guidance and that Helps to Avoid Some of The Choppiness. Here is an example.
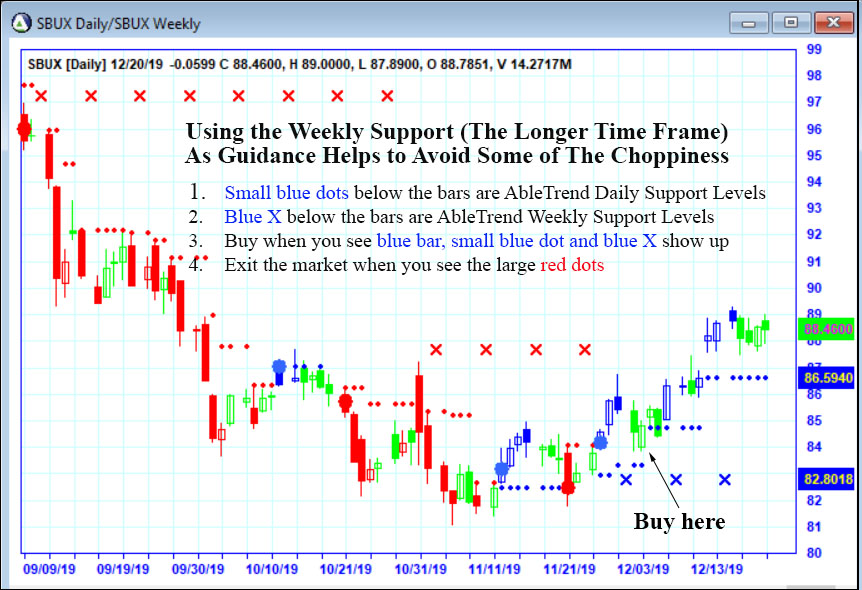
Since the blue Xs are the support levels for an uptrend and red Xs are the resistance levels for a downtrend, you wait to enter the buy position after a blue X shows up. As you can see in the above chart the market’s trend changed from red X to blue X. The entry rule is showing in the above chart. You can trust AbleTrend signals because once AbleTrend signals are generated and the bar closes the signals will never change again.
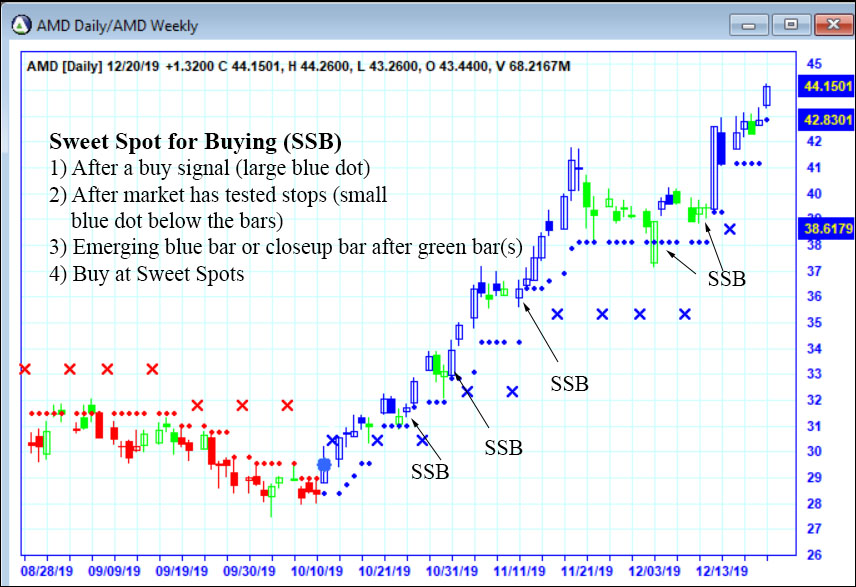
The chart below is showing you how you can add positions at Sweet Spots once you have defined the uptrend.
In the next blog, I will show you how to form a portfolio with APP.
Here is a 7-minu video
showing you how to systematically identify sweet spot and significantly improve your trading result.
Give a trial with hands-holding one-on-one consultant today. $30 off discount code: DTHS69
Long-time AbleTrend Users Sharing at Trustpilot
With Warm Regards,
Grace Wang
AbleSys Corp.
grace@ablesys.com
Leave a Reply
You must be logged in to post a comment.