View the Invisible Roadblocks that Trap Traders into Losing Trades
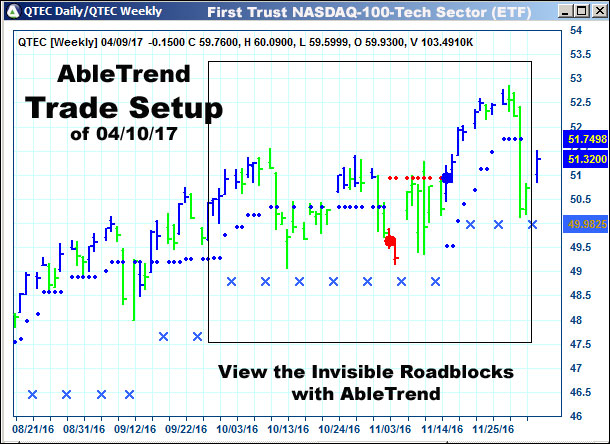
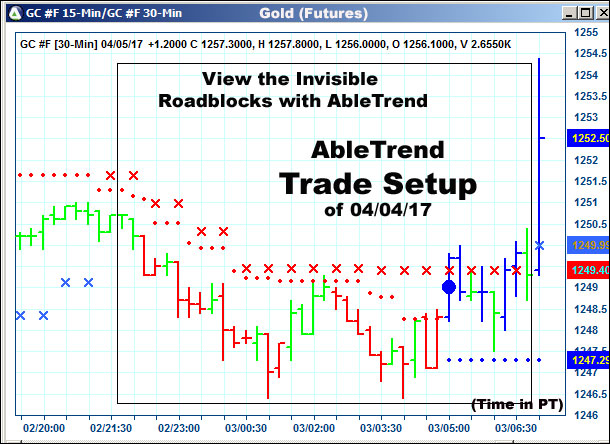
If you can view the invisible roadblock in the market you are trading which is the hidden support and hidden resistance in the market, you gain the edge of doing the following things: A) you can enter the market right after the market tests the visual roadblock and resume the trend with minimal risk; B) you can avoid market noise that traps traders into losing trades by looking at longer time frames; C) if the visual roadblocks are calculated dynamically you can stick with the winning trades without a premature exit due to fear.
AbleTrend Guidance Chart provides multi-level roadblocks dynamically for all freely traded markets
Here are a few recent charts.
 |
 |
 |
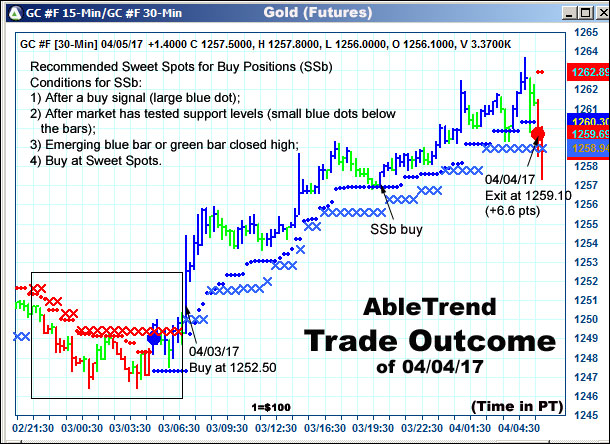 |
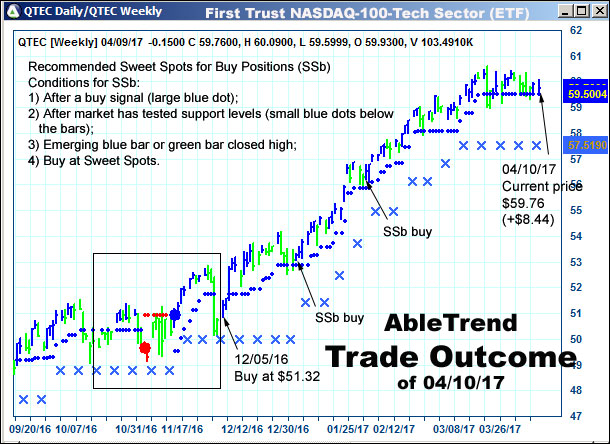
Verify your skill of analyzing trade setups by examining sample trade setups and outcomes
For your convenience we have established a “Trade Setups and Outcomes” section to practice on. There you will find many trade setups in various markets for both day trading and swing trading. Markets are ever-changing but AbleTrend trading rules remain the same. Practice the rules again and again just as a basketball player practices dribbling again and again, until you know how to apply these rules to real-time trading. Ready? Here are some Trade Setups and Outcomes with AbleTrend trading indicators applied.
With Warm Regards
Grace Wang
AbleSys Corp.
Gracezh@ablesys.com
Comments are closed.