Bull/Bear Battleground
To start, I want to apologize for the lack of blog content in the last couple weeks. This was due, in part, to starting off a new series of mid day market recaps. I think we’ve got the big pieces worked out there, and we should be back to normal operation with the market updates & longer form blog content.
Since the last post, we’ve seen markets notably down & up & back down again. As well as a real mixed bag of good trading days for day-traders – punctuated by really flat choppy sessions. This has a number of short term and long term implications that I’d like to talk about.
Downward price action is associated with Volatility in Trading Opportunities
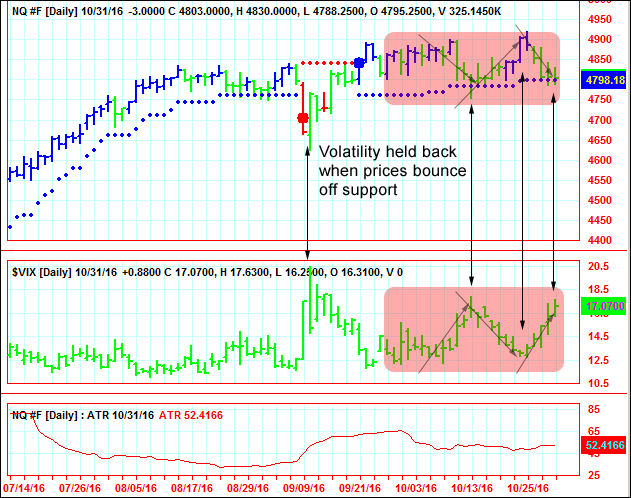
As you can see in the chart above, peaks and valleys in equity price action tend to be inversely associated with the peaks and valleys in their volatility. The short term take away for day traders is that your better trading days are naturally going to be during down days in the market. And inversely, when prices reach support, buying forces come back in and crush vol lower.
This can be incredibly frustrating, since volatility is really the big driver of trading opportunity & it is a big environmental factor that is really out of our hands. Each time things start to get fun again, we hit a pocket of support in the big picture, and the party is over.
But there is a possible silver lining…
Look at a really long term chart of the NASDAQ, and you’ll find that those moves off the blue dots were actually making new all-time highs. Yet, we’ve not had a really meaningful follow through to the move higher.
How convincing is the market strength, when new record highs are followed repeatedly by a retest of support? Even more interestingly, we can see that it’s really just that pocket of the market that was finding record highs. If we look instead at the S&P 500, we see a different story
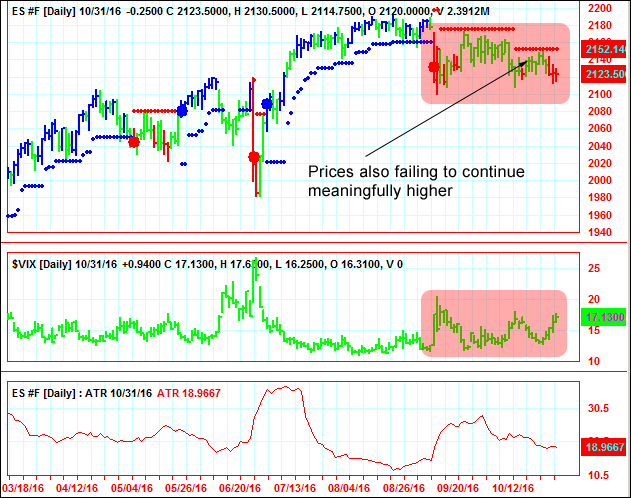
In a way, the lines have been drawn for this short term bull/bear battleground, which may determine the market direction for the next month or two. We would hope that the ES is telling the true story, and that prices break out lower. Prices going lower would mean a better chance at great trading opportunities. But we don’t need to guess:
- Current best practices using AbleTrend don’t encourage us to fight the tides
- Best practices are geared toward tightly managing risk & avoids unnecessary losses when trends cannot materialize
This should mean that we will make the most of the opportunities we do have & when price action fails to materialize, we will frequently be sitting out, or we will be out of the market with a small nominal loss.
As an example of this, see last Friday’s market recap, when we looked at the price action going into the afternoon session.
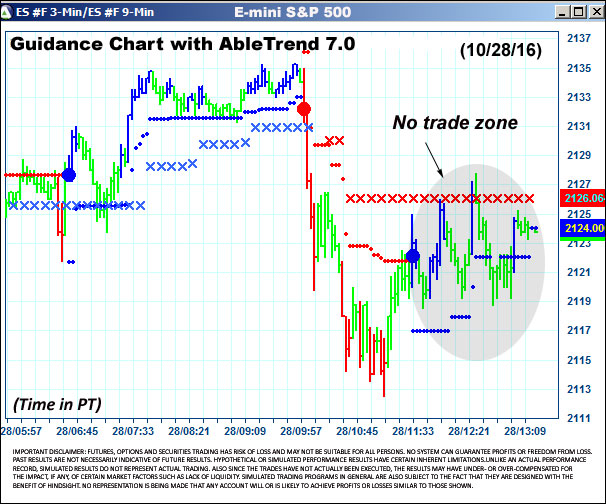
- We observed the market was up, then down, then up again
- We were hopeful for a move, but we if we never got it, we didn’t have to trade
- Following the call, we watched as the market traded in a 4 point range & a move never materialize
To see more clips like this as they go live during trading hours, you can subscribe to our youtube channel & turn on notifications for our channel. Click here to Subscribe
If you’re not using AbleTrend yet, this is the best way for you to see if the signals will work for you. Click here to see the offer details
Best Regards,
Jesse
Leave a Reply
You must be logged in to post a comment.