How AbleTrend Helps You to Define the Trend Changes Systematically
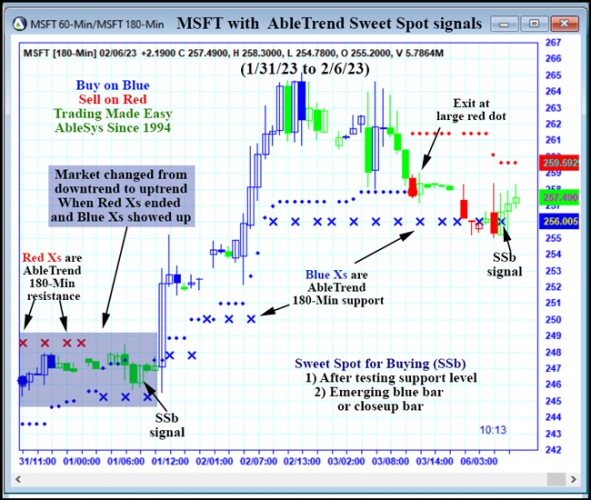
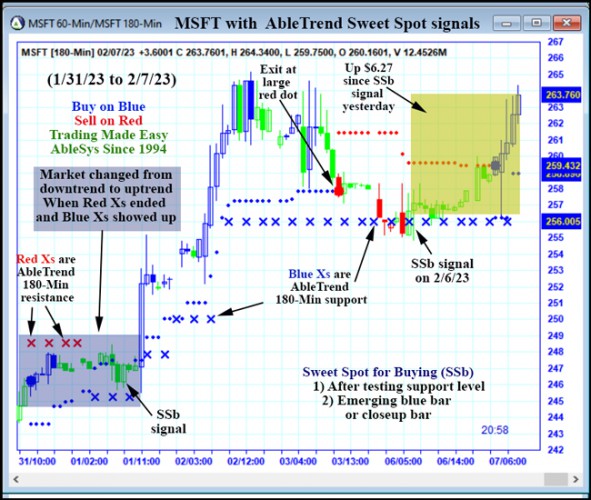
AbleTrend uses red Xs to show you 180-minute resistance levels and uses blue Xs to show you 180-minute support levels. Market changes from downtrend to uptrend when red Xs end and blue Xs show up.
You may apply AbleTrend to the historic charts and you will see this kind of transition time and time again. Once the uptrend defined, you can then buy at the sweet spot along the way during the uptrend. Pyramid thus made possible!
Following is a current example with MSFT charts:
AbleTrend reflect all the information about the market in the price action.
Make rational trading decisions based on the purest, most accurate signal in the world: Price!
Using AbleTrend is one of the easiest and most accurate ways to make logical trading decisions, based on the purest market data known: price movements.
When you have the easy to read AbleTrend signals at your fingertips, you don’t need to listen to news and commentaries about so called inside stories.
AbleTrend reflects all the information about the market in the price action. Then, nobody can fool you.
Join us for Live Analysis & Education
Join us Tuesdays and Thursdays at 5pm ET (2pm PT)
Ron Carbone -Veteran Trader & Educator at AbleSys will go over the latest AbleTrend trades on the chart: Click here to sign up
You can also view the latest recordings on demand by accessing the webinar archive
Leave a Reply
You must be logged in to post a comment.