AbleTrend Is the Safety Measure for Your Stock Holding
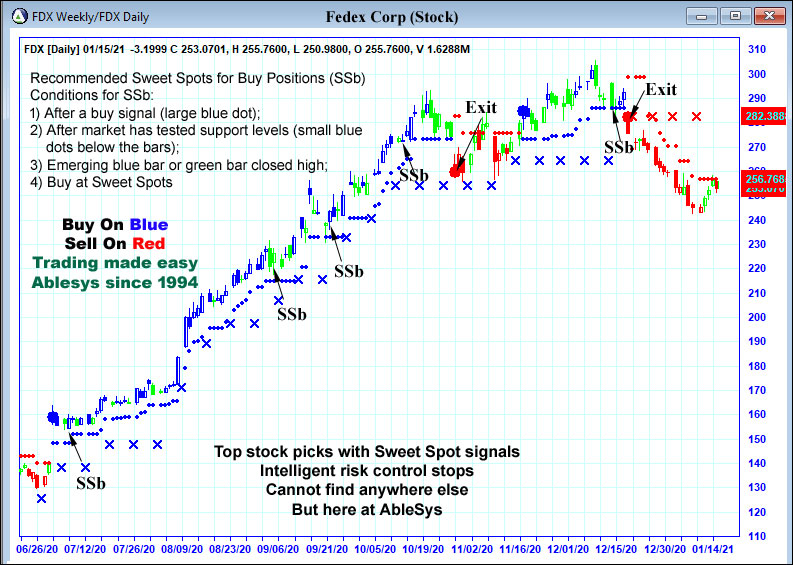
AbleSys provided an exit signal for FDX
AbleSys signals reveal the market truce support levels by blue dot for daily support level and blue x for weekly support level. If the current pull backs penetrate the weekly support and stay below the blue x, exit the market. Here is an example.
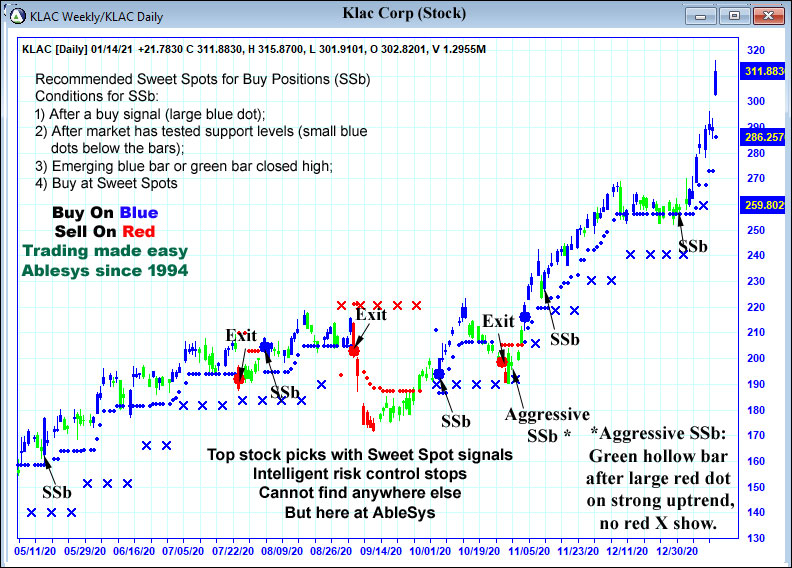
AbleSys provided Sweet Spot buy signals since 11/3/20 for KLAC
If the current pull backs just test the weekly support, you may want to wait and see if it is going to form a sweet spot with the blue bar or hollow bar, which will be the best place to buy at dip. Here is an example.
 If you don’t know the true market support levels…then fear will drive you out of market when you should stay, or you will stay in the market too long with losing positions. AbleSys blue dot and blue x are clearly showing on your chart, if you can read the chart you could do better than most fund managers and save a bundle in service fees.
Google organic search ranking 1st places
If you google search these key words: swing trading software, e-mini trading software or position trading software, AbleSys’ WinTick are at the 1st places at present with organic searches. Again, this is no small achievement. You may spend hundreds of thousands of dollars to develop a program of your own or take advantage of this time-proven winning program.
Tracing AbleSys Signals for Top Stock Picks January 15, 2021
We post fresh stock picks daily
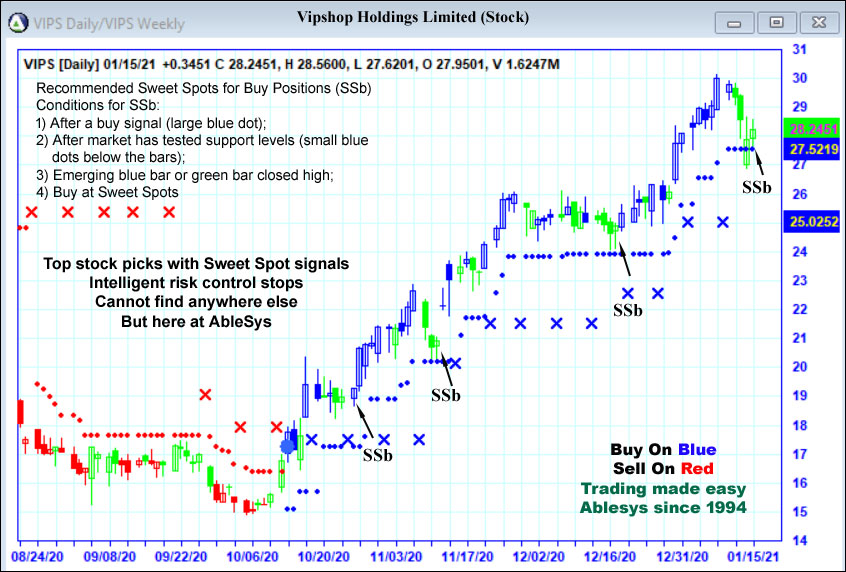
We post two types of stocks daily. One type of posting showing the fresh sweet spot low risk entries and the other type of posting showing the results of the stocks picked earlier. You may trace the earlier AbleTrend signals below each stock charts we post. You may verify all the signals if you have a trial of AbleTrend in hands. You can not find this kind of service anywhere else online, but here with AbleSys. Here is one of today’s charts.
An added margin of risk management:
AbleSys’ dynamic intelligent stops
AbleSys signals tell you where to place protective stops as a defense measure to preserve gains or limit losses. AbleSys software uses principle-based intelligent stops -stops defined by the market’s own support and resistance levels. Small blue dots below the bars are AbleTrend stops for buy positions and small red dots above the bars are AbleTrend stops for sell positions. These intelligent stops are dynamic and automatically adjusted by the software as prices change.
Tracing Back the AbleTrend Earlier Signals
When checking through the AbleSys Top Stock Picks, you can now trace back the AbleSys earlier signals by click the links below each chart. You may also go to Chart Library to search all the historical posting for the symbols. You can not find this kind of resource for finding the best stocks anywhere else, but here.
The Power of Pyramid
Imagine you were able to add positions at each sweet spot (SSb) with confidence if you had AbleTrend software in hand. You buy a few shares at the early SSb, then add more shares along the way uptrend, and raise your initial stop to cover the cost. And you add more shares by risking the market’s money for your advantage. That is the power of pyramid.
Benefits of Follow the AbleSys Signals on Top Stock Picks
- You now have the list of top stock picks. That is “what to trade” and you may find out “when to trade” by using AbleTrend AutoScan to view the buy on blue and sell on red signals for this list of stocks at glance.
- You may buy a few shares of these top stocks at their SSb to build your confidence progressively.
- Knowing how much is your risk before you buy shares, because AbleTrend support dots showing you the optimal stop prices.
- Leveraging market’s money to your advantage once your first purchased shares gain some profit, you can now raise your stops according to AbleSys support dots. You then have the luxury of risking the market money for the trade.
- You will see the updates of these stocks’ performance along the way with the trends
- You’ll see the Sweet Spots for entries
- You can search the historical charts for specific stock symbols by click the top blue bar above the list of stock symbols.
- See AbleTrend exit signals with large dot when trend changes
- The pyramid way of compounding your investment become possible by knowing the AbleTrend support dots, which reveals the objective market support levels.
The best way to learn a skill using trading software is by practicing it. Through the webinars and free one on one trading sessions it will help you to prepare for actual trading on the live markets and it will not tell you how your psychology will react to the experience. This insight is gained only through experience so give AbleSys trading indicators a try today.
Leave a Reply
You must be logged in to post a comment.