AbleTrend Signals Before and After Financial Crises
The market crisis brings opportunities if you have the right tool to help you to identify the objective trend directions early. In this email I will show you:
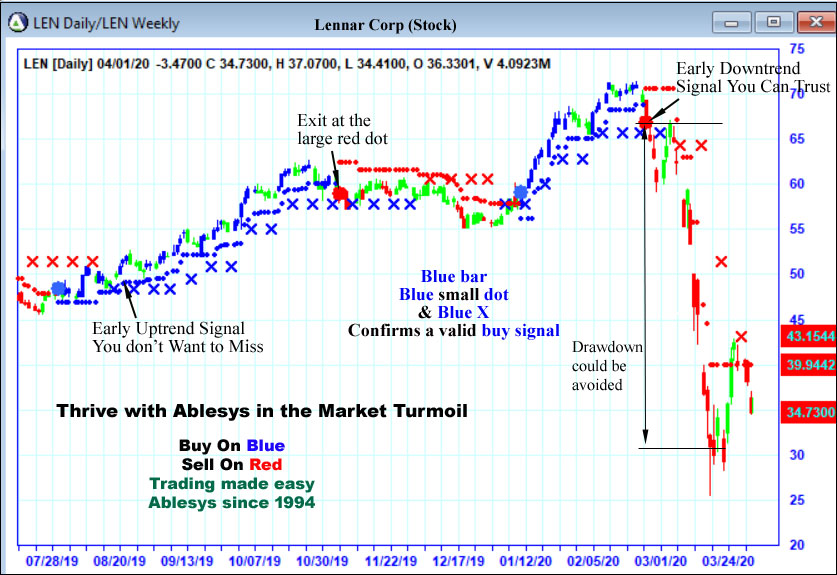
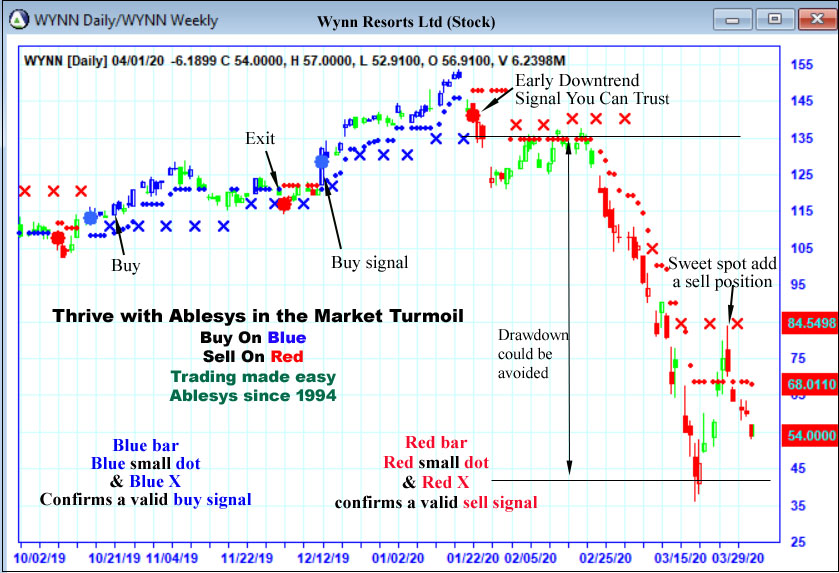
The current AbleTrend signals for some popular stocks,
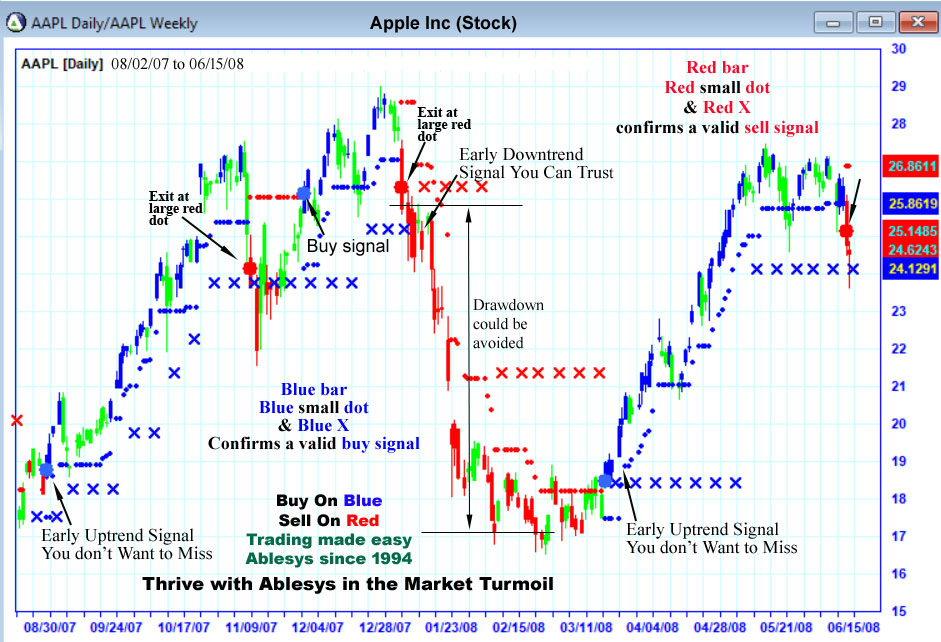
AbleTrend signals before and after the financial crisis of 2008
The current AbleTrend signals for some popular stocks
AbleTrend signals before and after the financial crisis of 2008
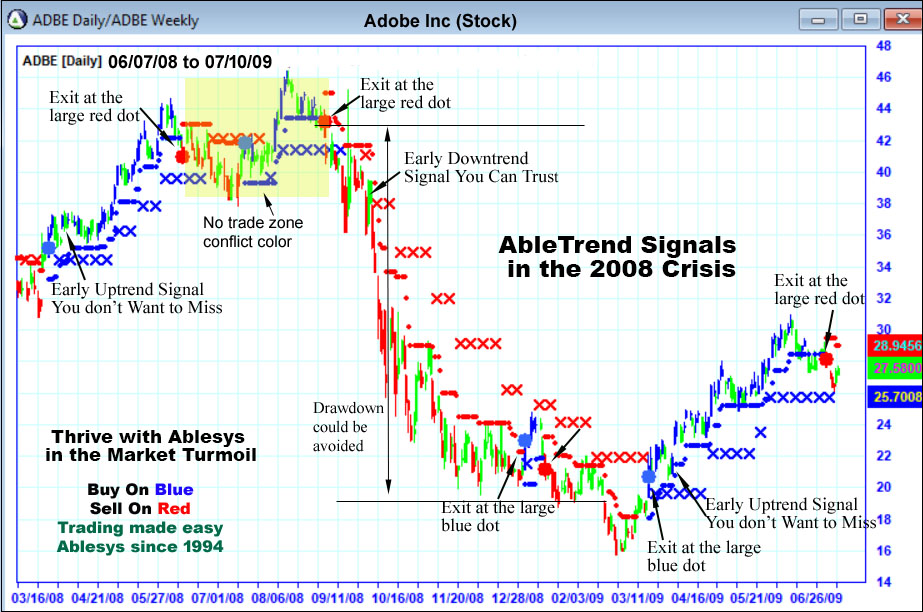
AbleTrend Guidance Chart Rules for Buy Position:
1. Small blue dots below the bar are TS 1-minute support levels;
2. Blue X below the bars are 3-minute support levels;
3. Buy when you see large blue dot, blue X and blue bar;
4. Exit the market when you see the large red dot.
AbleTrend Guidance Chart Rules for Sell Position:
1. Small red dots above the bars are TS 1-minute resistance levels;
2. Red X above the bars are T3 3-minute resistance levels;
3. Sell when you see red X, red bar and large red dot;
4. Exit the market when you see large blue dot
Leave a Reply
You must be logged in to post a comment.