Less Guesswork in Stock Trading
We each tend to think that we see things as they are and that we are objective but this is not true. How many times did you think the stock have every reason to go up but it went the opposite way? Is there a trading tool that can help you to see the market more objectively and clearly? Yes, that’s AbleTrend. It defines low risk trades objectively helping traders to follow the market trends making profits.
AbleTrend is a trading software which projects the market direction with colors. Here are some recent stock trading charts with AbleTrend guidance chart applied.
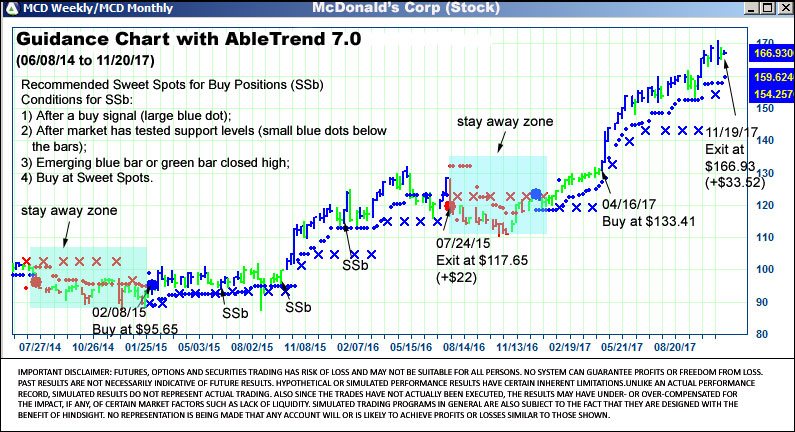
AbleTrend Guidance Chart Rules for Buy Position:
- Small blue dots below the bar are TS daily support levels;
- Blue X below the bars are T3 weekly support levels;
- Buy when you see large blue dot, blue X and blue bar;
- Exit the market when you see the large red dot.
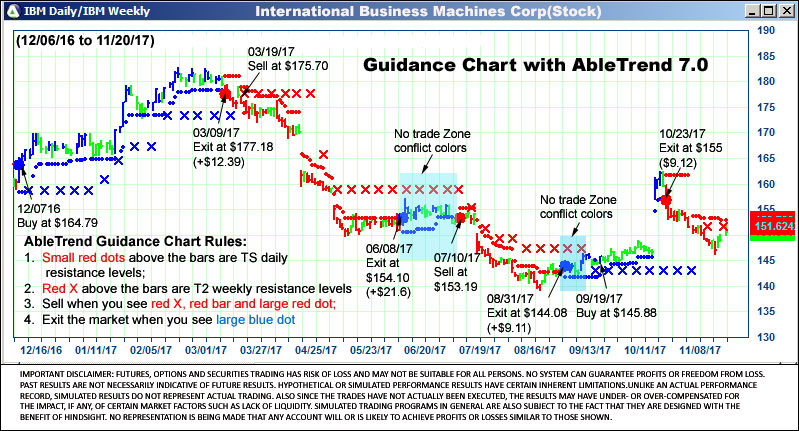
AbleTrend Guidance Chart Rules for Sell Position:
- Small red dots above the bars are TS daily resistance levels;
- Red X above the bars are T2 weekly resistance levels;
- Sell when you see red X, red bar and large red dot;
- Exit the market when you see large blue dot
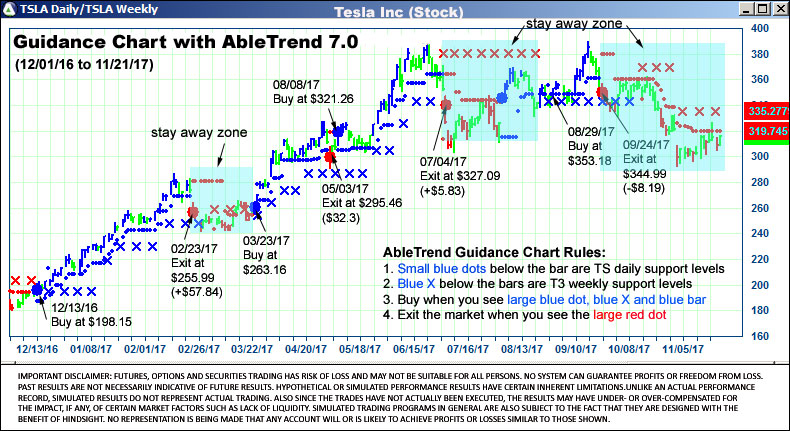
As you can see the chart above, AbleTrend helps you to stay away from choppy periods and down trends with a clear, large, red dot exit signal. No hesitation, no guess, straight forward signals.
You may learn more details about AbleTrend guidance chart with this Free 4-Day Mini-Course the Blueprint for Trading Success ($500 value. Limited offer.)
The best way to learn a skill is by practicing it. Through guides and tutorials, we will help you prepare for actual trading on the live market so you`ll know how your psychology will react to the experience. This insight is gained only through experience so give AbleTrend a try today.
With Warm Regards
AbleSys Corp.
Grace Wang
gracew@ablesys.com
Leave a Reply
You must be logged in to post a comment.