How to Exit Decisively At Market Trend Reversals
After showing you how to avoid exiting winning stocks prematurely we are going to show you how to exit decisively at trend reversals today.
Knowing the Underline Market Support Levels Will Help Keep Your Profits.
We have seen so many traders and investors go through the trading roller coaster and leave huge profits on the table unharvested. This kind of tragedy can easily be avoided if they had known the AbleTrend support and resistance levels, the blue dots and red dots. Here are some chart examples to show you how AbleTrend support and resistance level signals can help you stay with your winners relentlessly and exit decisively at the market trend reversals.
If you can systematically define the true market support levels – the periodic market floor while buying, you can place your protective stops based on those levels. If the market resumes the current trend, it will not take your protective stop; but if market trend has changed direction, it will hit your stop but you will not lose too much. AbleTrend T2 indicators have been doing a great job with risk control by putting your stop loss at the previous lower row of dots away from the price, not the dot under the price.
For buy positions:
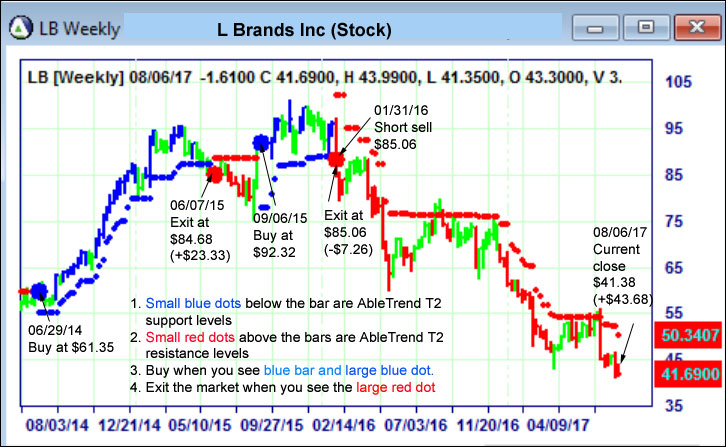
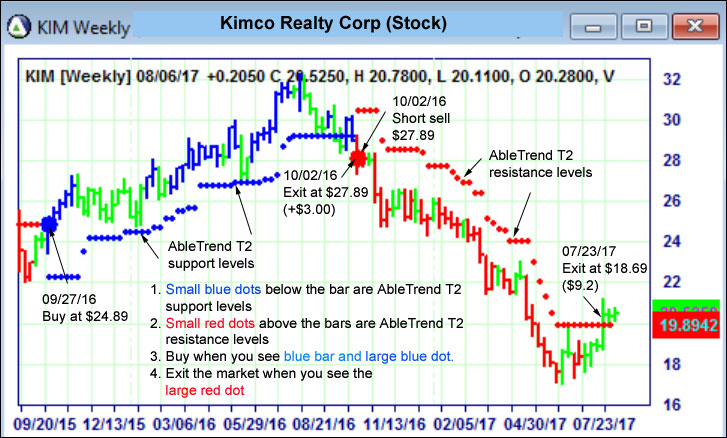
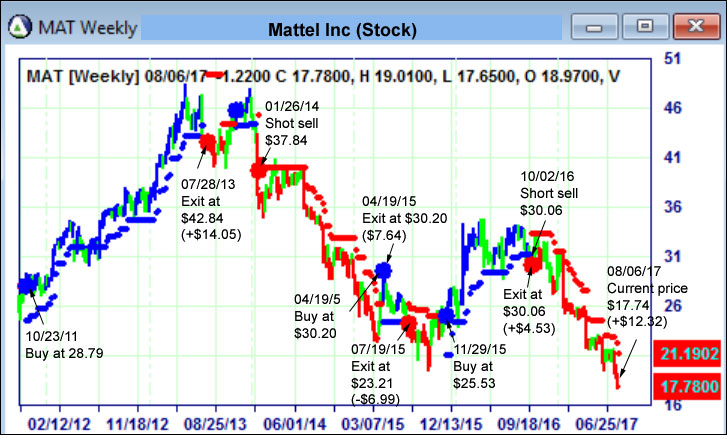
- Small blue dots below the bars are T2 weekly support levels;
- Buy when you see blue bar, large blue dot and small blue dot all show up;
- Place a stop at previous T2 weekly support level;
- You may exit at the next bar open when you see the bar close below the T2 previous support level;
- Or exit the market when you see the large red dot.
For sell positions:
- Small red dots above the bars are T2 weekly resistance Levels;
- Sell when you see red bar, large red dot and small red all show up;
- Place a stop at previous T2 weekly resistance level;
- You may exit at the next bar open when you see the bar close above the T2 previous resistance level;
- Or exit the market when you see the large blue dot.
Will these stops work?
You can test the stops with 10 years of historical data with weekly price bars. The market is the ultimate judge. If you see things happen more often than others, you have built confidence using them in the real trading.
FREE Stock Holding Clinic
Do you hold stocks? Would you like to know the true market support and resistance levels? email us your stock holding symbols, we’ll email you the charts with AbleTrend blue dots and red dots for support and resistance levels. Limit with 3 symbols per email.
To help you get ready to take full advantage of the upcoming market trends we are making you this special offer.
As always, please feel free to forward this email to your friends and they will appreciate the wisdom you share with them!
SUBSCRIBE to the Wintick/Abelsys Channel on YouTube
READ the BLOG HERE
With Warm Regards
Grace Wang
gracew@ablesys.com
Leave a Reply
You must be logged in to post a comment.