Knowing the Market Directions Trading Becomes Easier
May 29, 2017
The U.S. stock markets reached historical highs Recently. Markets were solidly higher for the week last week, as the DJIA jumped 1.3%, the S&P 500 Index rallied 1.4%, and the Nasdaq Composite surged 2.1%.
View the market as you would view an oil painting
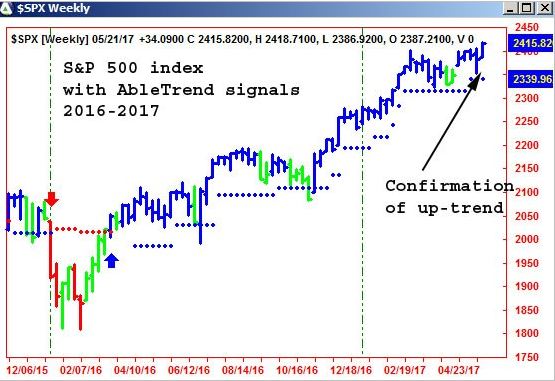
The up-trend signals have been very clear in the last 18 months, see figure below, the S&P 500 index chart with AbleTrend buy/sell signals. The historical high close of last week is a new confirmation of the up-trend. However, some traders told us the markets were very choppy and were hard to trade. In fact, in trading you should not focus on the small spots, you must have a whole picture of the market moves – it’s going up or down. Just like seeing an oil painting, you must view it from a relative far distance. Therefore, it’s helpful to use AbleTrend weekly charts to guide for trading. When you see clearly the markets are in the up-trend, trading became easier. We may simply buy at Sweet Spots.
Differentiate Reversal from Retracement with AbleTrend Support Levels
The small blue dots below the bars are market defined support levels, the floor for the uptrend. AbleTrend support levels (the small blue dots) helps you to differentiate reversal from retracement. AbleTrend empowers you to stay on top of your positions with a clear vision in mind all the time.
View more recent Guidance Charts applied for Eminis, stocks, futures, and FOREX.
Sincerely,
Grace Wang
VP of AbleSys
20954 Corsair Blvd.
Hayward CA 54542
gracezh@ablesys.com
Leave a Reply
You must be logged in to post a comment.