Looking Back and Looking Forward
We are approaching the end of the year 2016 that has been a roller-coaster ride in the markets. Looking back at the charts of various markets with AbleTrend signals may help you to change your perspective.
Looking Back
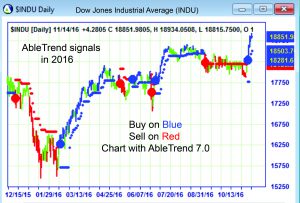
This is the big picture of the Dow Jones Industrial Average for the year. You will always be in the right direction of the market if you train yourself to follow the blue and red AbleTrend signals.
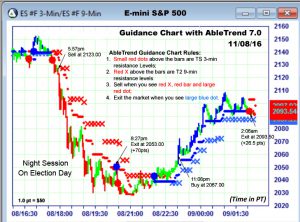
E-mini S&P with AbleTrend 3-minute/9-minute guidance chart on the night session of Election day. Uncertainty Brings Opportunity in The Markets. When most people are in doubt and you have AbleTrend in hand, you have seen how the signals worked time and time again. Your subconscious mind is confident in yourself and in the system. Your trading decisions become second nature. You simply apply the rules as you have practiced. No doubt, no fighting, no scaring, just put on and take off the positions with pre-calculated risks.
Chart Setups and Outcomes
Here are a few chart setups and outcomes with AbleTrend:
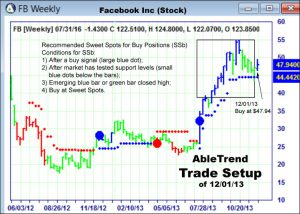
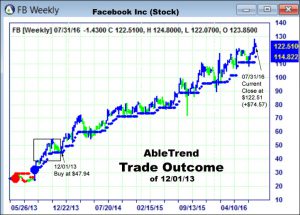
Face Book Chart Setups and Outcomes
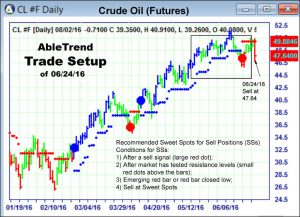
Crude Oil Chart Setups and Outcomes

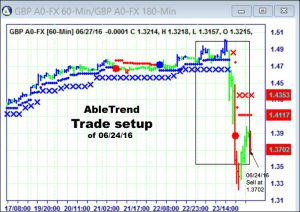
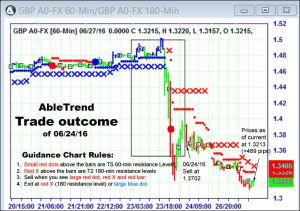
GBP Chart Setups and Outcomes
After reviewing all these charts you may wonder: if AbleTrend was curve fitted and the answer is NO. A curve fitted program is useless for real trading. Your doubt is legitimate for there are so many false claims in the market yet you can always trust AbleTrend because:
- AbleTrend is universal and robust.
If a trading system is designed for a particular market with a particular time interval, the programmer can easily “curve fit” the historical data and come up with an unrealistic, overly optimized program.
Beware of programs designed to trade only one particular market with a particular time interval for instance, a system that only trades the e-mini S&P 2-minute chart. Reason: there is a very high likelihood that the program is curve-fitting the historical data.
A program based on curve-fitting is worthless. Why? Financial markets are dynamic and constantly changing. An algorithm based only on historical data ideally would work well only during that historical period Only algorithms based on timeless and universal market principles work in today’s markets – and in all markets, all the time.
- AbleTrend signals will not be changed in the future testing
AbleTrend signals have real value in trading because once the signals generated after the closing of the bars, the signals will always stay the same and not be changed in the future testing. This is very important which differentiate AbleTrend from many other software programs on the market.
Looking Forward
We have a newly elected President who will take office in 2017. While some investors may choose to speculate how new policies will affect the economic and investment landscape under president-elect Trump, we believe that because AbleTrend reveals the fundamental principle of the market, it may change the way to view and trade the markets.
Opportunity goes to those who are prepared
In order to win in the markets you need two things: 1) A winning system that has been tested in the bull and bear markets applicable to markets around the world; 2) You must practice to apply the rules either through paper trading or trading with real money till executing signals become a second nature of yours.
To help you to take advantage of the volatility of the election year this November we are making this special offer for you. Test Drive AbleTrend for 30 days, just $99!
Even better news is that at the end of the trial period you may apply the trial price towards lease price with the biggest sale of the year. Take this special offer now by test Driving the software for yourself and you’ll never see the market the same way again!
With Warm Regards,
Grace Wang
AbleSys Corp.
Leave a Reply
You must be logged in to post a comment.