Buy at Dip or Take Profit and Run
When shall you buy at the dip and when shall you take profit and run when the market retraces? In another words, you want to know if the current market drop is a retracement or a down trend has formed that you should exit your position. AbleTrend helps you distinguish between the retracement and reversal. Today we’ll show what retracements look like and what reversals look like with AbleTrend applied guidance charts.
Buy at Dip examples
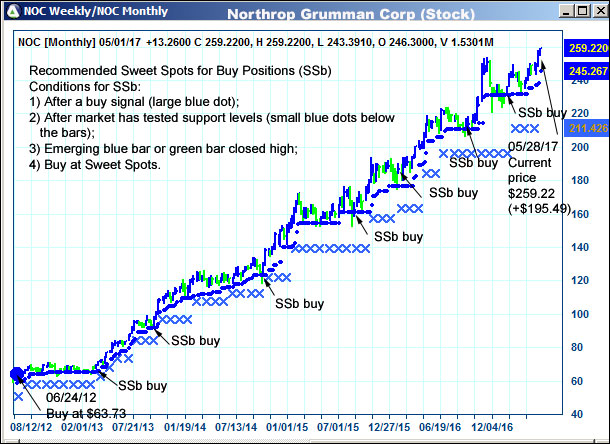
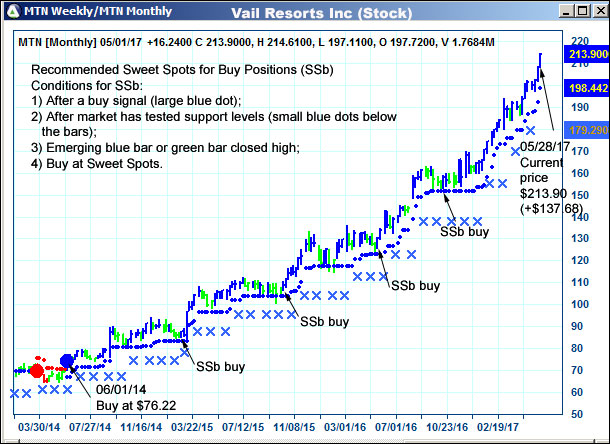
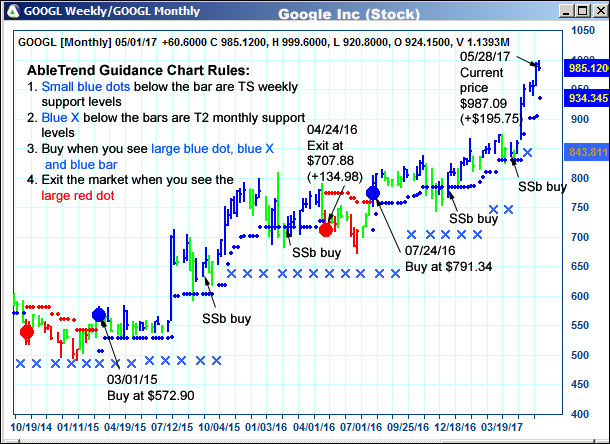
These are weekly charts; each bar represents the price of the week. Large blue dot is a buy signal and large red dot is a sell signal. Blue bars indicate an uptrend and red bars indicate downtrend. A hidden monthly chart is applied and blue X is the market support levels based on the monthly chart; and red X is the market resistance levels based on the monthly chart.
Taking a small profit and run is one of the problems investors facing. When you define an uptrend, you want to not only be able to stick with the trend, but also be able to add to positions at sweet spots. By following simple Sweet Spot rules, AbleTrend trading software empowers you to do just that.
Taking Profit and Run Examples
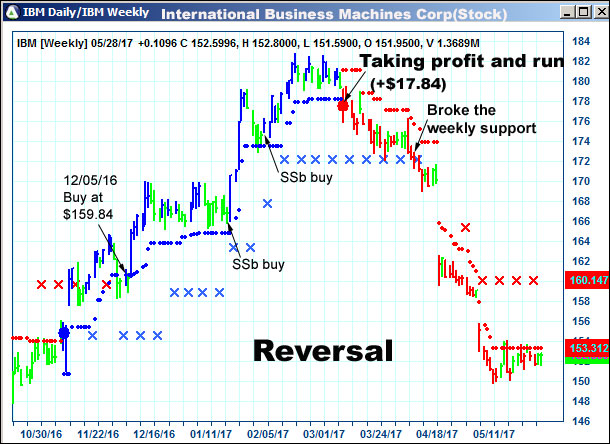
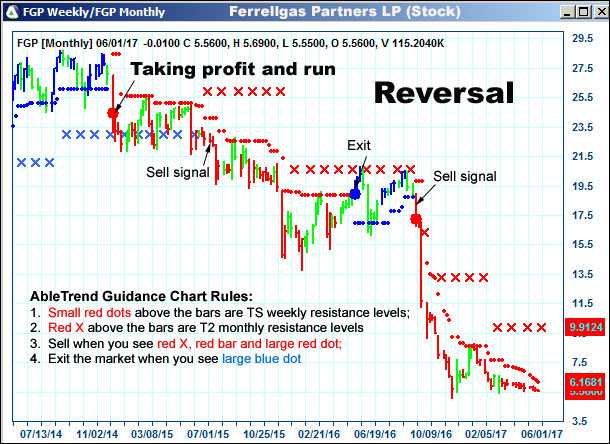
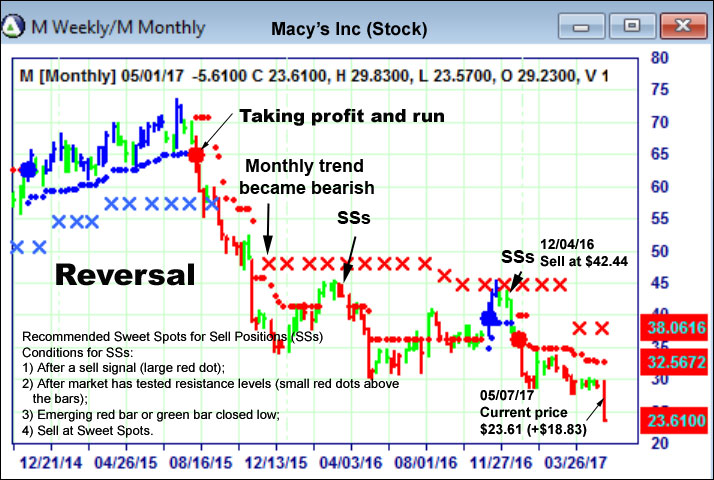
There are two levels of confirmation when the uptrend switched to the downtrend: First when the weekly large red dot and red bar broke the blue X, the monthly support level, we know the long term monthly support level has broken, therefore the uptrend is finished, take profit and run; Second, the red X showed up further confirming the trend direction from uptrend to downtrend is completed. Once trend direction change is confirmed, it’s the time to look for sweet spot to sell.
To learn what the Sweet Spot looks like and how to find more of them, and how these trades evolved in the recent trades, visit our Trade Setups and Outcomes examples.
With Warm Regards
Grace Wang
AbleSys Corp.
Gracezh@ablesys.com
Leave a Reply
You must be logged in to post a comment.