Let Time-Tested AbleTrend be Your Guide!
AbleTrend first helps you to time entries at low-risk sweet spots. Then it helps you to manage the risk on the trade, and shows you when to exit.
Following are two recent charts with TSLA and AMZN:
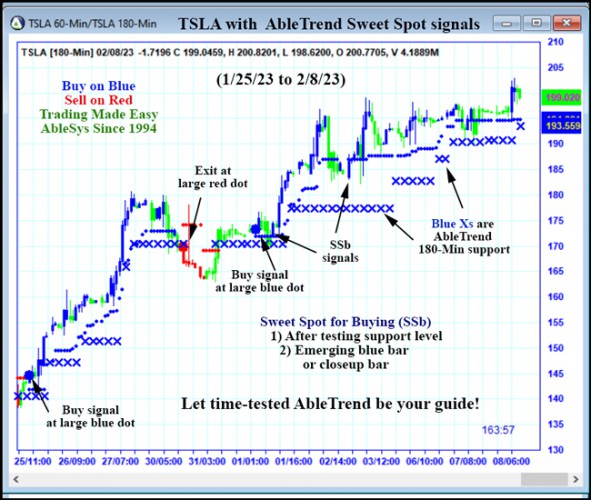
AbleTrend helps you to sit tight with winners because the blue Xs kept moving up without the price breaking through it so that confirms the uptrend. You gain trading confidence because you saw AbleTrend has been working time and time again for many years.
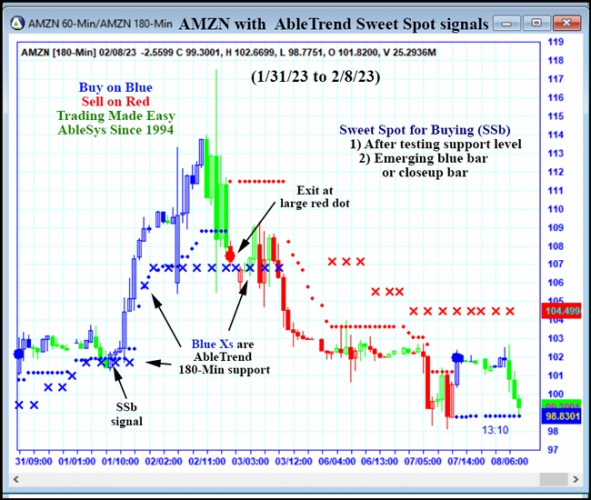
AbleTrend uses blue Xs to show you 180-minute support levels and AbleTrend uses red Xs to show you 180-minute resistance levels. The markets longer term view changes from uptrend to downtrend when blue Xs end and red Xs show up. You may apply AbleTrend to any historic charts and you will see this kind of transition time and time again.
AbleTrend reflects all the information about the market in the price action.
Make rational trading decisions based on the purest, most accurate signal in the world: Price!
Using AbleTrend is one of the easiest and most accurate ways to make logical trading decisions, based on the purest market data known: price movements.
When you have the easy to read AbleTrend signals at your fingertips, you don’t need to listen to news and commentaries about so called inside stories.
AbleTrend reflects all the information about the market in the price action. Then, nobody can fool you.
Join us for Live Analysis & Education
Join us Tuesdays and Thursdays at 5pm ET (2pm PT)
Ron Carbone -Veteran Trader & Educator at AbleSys will go over the latest AbleTrend trades on the chart: Click here to sign up
You can also view the latest recordings on demand by accessing the webinar archive
Leave a Reply
You must be logged in to post a comment.