Direction of Current Stock Markets
There are a few concerns for the US stock markets, such as US-China trade war, the US 10-year Treasury yield falls below 1.5%, below the 2-year note, recession fears rise etc.. Since July 16 the Dow reached its high at 27,398, for the last 7 weeks the Dow and US stock markets experienced much higher volatility, it dropped and kept below its all time high.
How do you see current stock markets? What direction to go – up, down, or sideway? We sit back and study a big pictures of the Dow Jones index with weekly chart. Below is the weekly chart of the Dow Jones index with AbleTrend signals in the last 3 years.
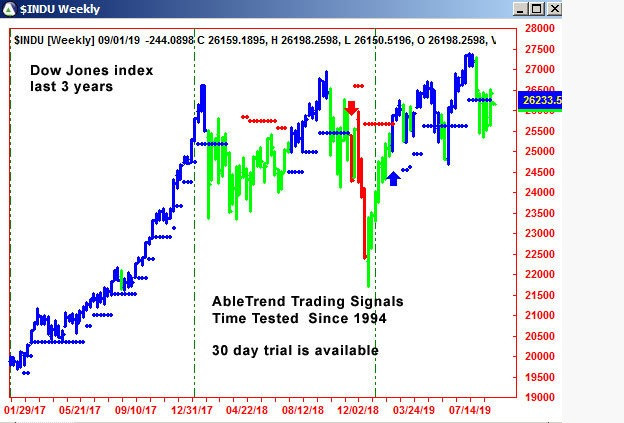
We clearly see the small blue dots line up around 26,234, and the green bars of last 6 weeks. Based on current market conditions, the market is on a sideway, but favour is still on LONG (up) side. Accordingly trading strategies could be: (1) Stay away from this market, hold cash position, or (2) Use short time interval such 120-min charts, trade with AbleTrend BUY signals only. Always watch the T2 small blue dots which tells to exit or hold the long positions. With the signals we may know right or wrong at any moment.
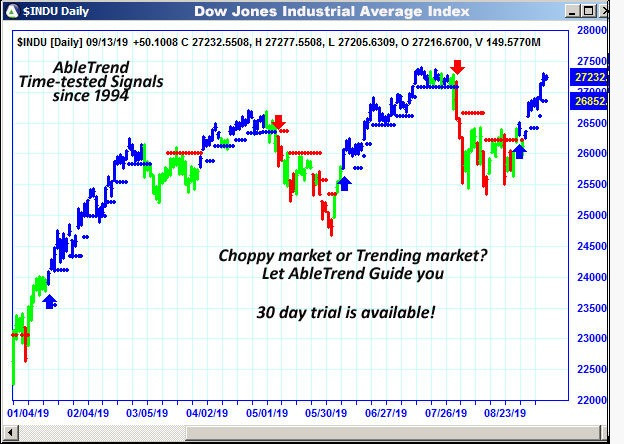
Today is September 15, what’s happened now? Let’s see a daily chart of the Dow index below. 9 days ago, the up-trend of Dow formed with the daily chart. We may follow the LONG signals to trade easily.
AbleTrend is a principle-based trading software which received Reader’s Choice Awards from S&C magazine for more than 23 years.
Get a trial with hands-holding one-on-one consultations today.
$30 OFF discount code: DTHS69
With Warm Regards,
John Wang
AbleSys Corp.
Leave a Reply
You must be logged in to post a comment.