The Genius Trading Blueprint
Trading becomes rewarding and simple when you do these three things: 1. spot the sweet spot with a good risk/reward ratio; 2. know exactly where to place the stop loss; 3. Avoid the no-trade zone. AbleTrend guidance chart provides you exactly that. Here is today’s E-mini S&P 3m9m chart with AbleTrend guidance chart signals.
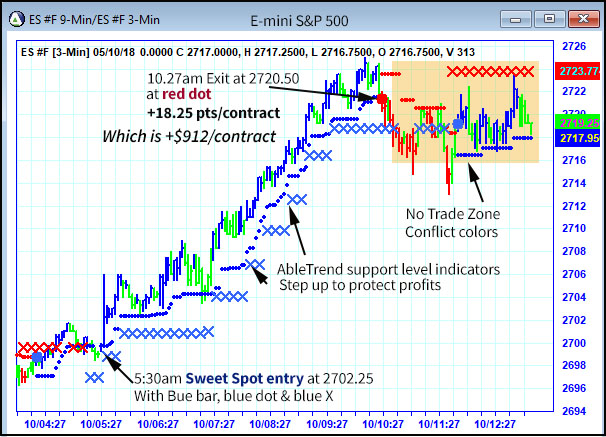
As it shows in the above chart, at 05:27 you spot a guidance chart buy signal confirmed with blue bar, blue dot and blue X.
This is a 3-minute chart, each bar is 3 minutes. The small blue dot below the bar are 3min support levels; the blue X below the bar are 9min support levels.
Support levels indicated by small blue dots are like floors where prices are holding, if price cannot hold and falls and penetrates the support levels, you want to exit the market and cut the loss short. Many times, markets just know exactly where the stop loss amount will test support levels before resuming the trend on a larger sale. If you know where the support levels are, you can watch the market as it tests the support levels with ease. You will not be scared and prematurely exit the market and will be able to continue to profit as the market goes up. That’s exactly what AbleTrend provides.
Following is a breakdown of Sweet Spot Advantages
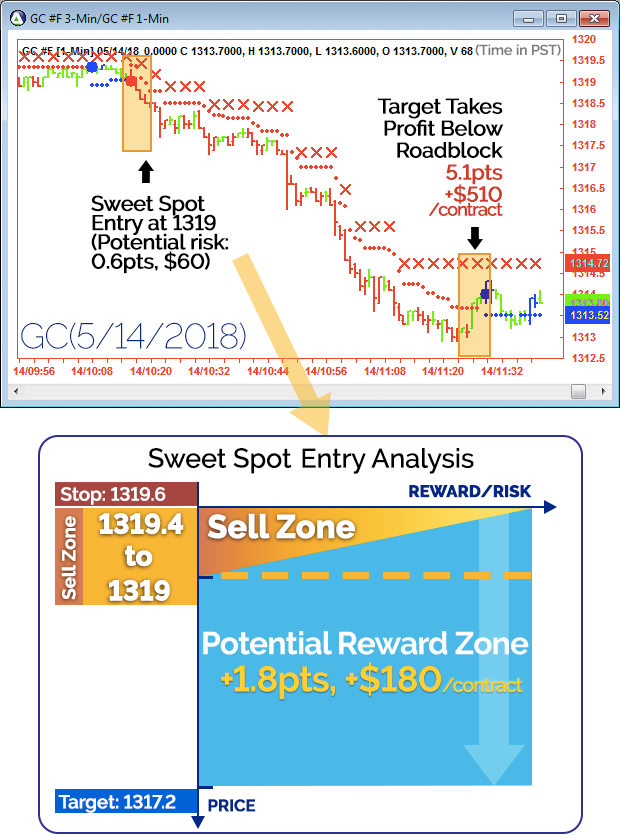
For each sweet spot entries, you know exactly these three things. a) You can specify a buy zone; b) know exactly what the stop loss amount will be; c) know the potential reward zone.
Thrive with these easy to use and reliable trade signals with the current market opportunities, try it now!
Now through 5/17/2018
AbleTrend 30-Day Trial now just $59 (code: GTBP77 order online)
Try AbleTrend this month & Lock in Special Pricing for Lease & Purchase Any Time Before Trial Ends
With Warm Regards
AbleSys Corp.
Grace Wang
gracew@ablesys.com
Leave a Reply
You must be logged in to post a comment.