Trading E-min S&P and NASDAQ with AbleTrend Guidance Chart (8/22/17)
Being able to identify an early trend is amazing, but even more remarkable is having AbleTrend show you where to place your protective stops before you even enter the market. You know the exact reward/risk ratio ahead of each trade, based on our objective support and resistance levels. Here are the E-mini S&P 500 and NASDAQ charts with AbleTrend 3min-9min Guidance Chart (8/22/17)
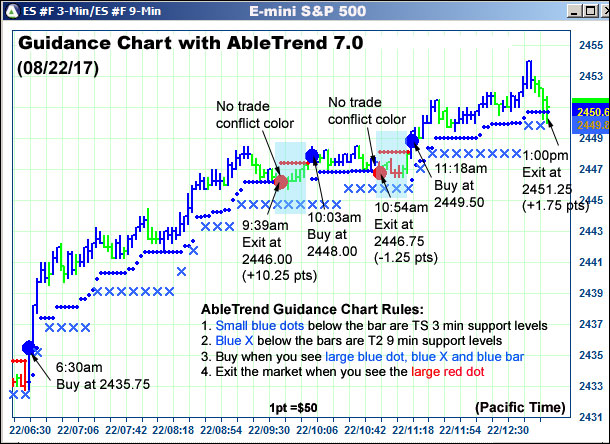
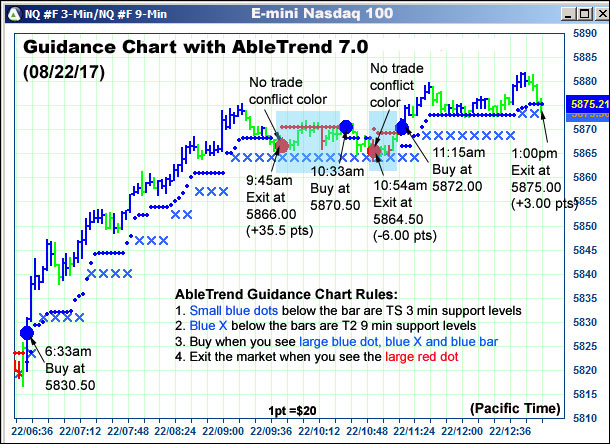
AbleTrend hidden support/resistance levels are designed to help you stay in the big move with minimum risk and avoid getting stopped out too early.
Many times, markets just test support or resistance levels before resuming the trend on a large scale. If you know where the support/resistance levels are, you can watch the market as it tests these levels with ease. You will not be scared and prematurely exit the market and will be able to continue to profit as the market goes up. That’s exactly what AbleTrend provides. AbleTrend hidden support and resistance levels are dynamic and automatically adjusted by the software as prices change in real time because they are determined by the actual market conditions and they are:
Objective
Back-testable
Visual and easy to use
Reliable in real trading
To help you get ready to take full advantage of the upcoming market trends we are making you this special offer.
View AbleSys YouTube
Explore Trade Setups and Outcomes
As always, please feel free to forward this email to your friends.
With Warm Regards
AbleSys Corp.
Grace Wang
gracew@ablesys.com
Leave a Reply
You must be logged in to post a comment.