Thrive with AbleSys in the Volatile Market
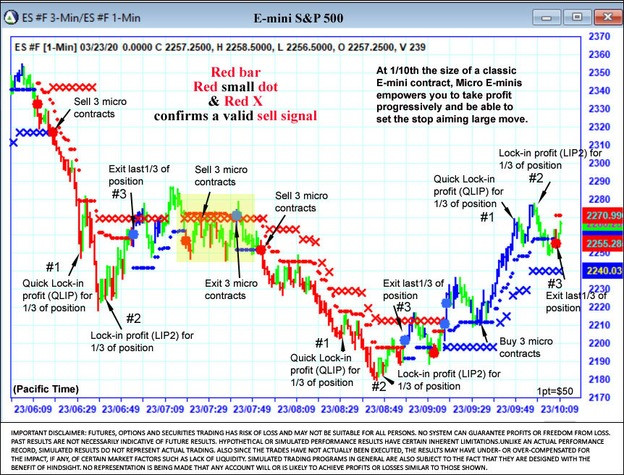
Recent volatility gave great opportunities for E-mini day traders using AbleTrend. Here are two recent charts with AbleTrend Guidance Chart.
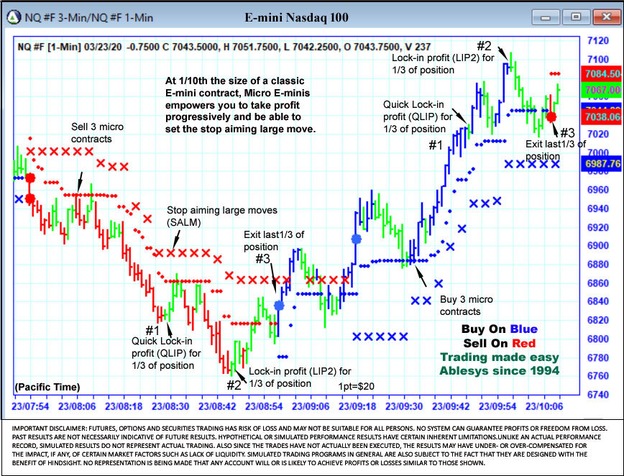
AbleTrend Guidance Chart Rules for Buy Position:
1. Small blue dots below the bar are TS daily support levels;
2. Blue X below the bars are weekly support levels;
3. Buy when you see large blue dot, blue X and blue bar;
4. Exit the market when you see the large red dot.
AbleTrend Guidance Chart Rules for Sell Position:
1. Small red dots above the bars are TS daily resistance levels;
2. Red X above the bars are T3 weekly resistance levels;
3. Sell when you see red X, red bar and large red dot;
4. Exit the market when you see large blue dot
Leave a Reply
You must be logged in to post a comment.