What’s Next Following Record Highs?
Following last week’s new record high in NQ, there remained some uncertainty about whether the breakout is the real deal. It wasn’t until Monday this week that there was a trading session that broke out and settled on highs. That seemed to give the OK for prices to continue up, which it did, on positive earnings from tech names including TWTR, MSFT and FB.
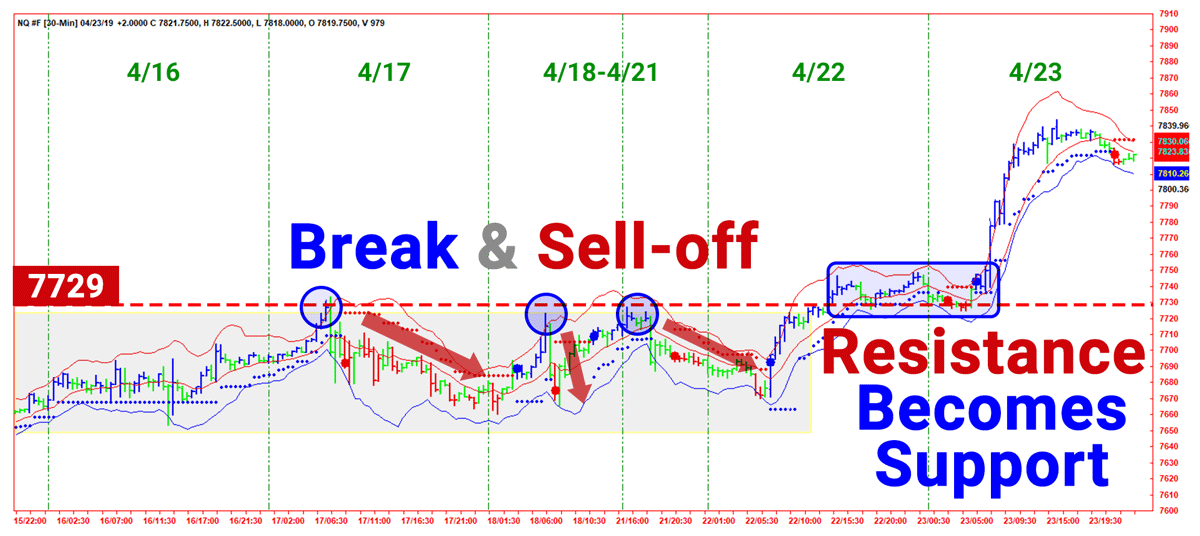
Stocks traded up Tuesday Morning with TWTR Earnings Release Premarket
This would seem to cement the idea that the bulls are in control, however this is also where trading can become tricky. That’s because we will often see compressing volatility as prices grind higher. It’s good for investors, who just want to hold on to some long beta exposure, but the trading sessions can be smaller and less trending for day traders.
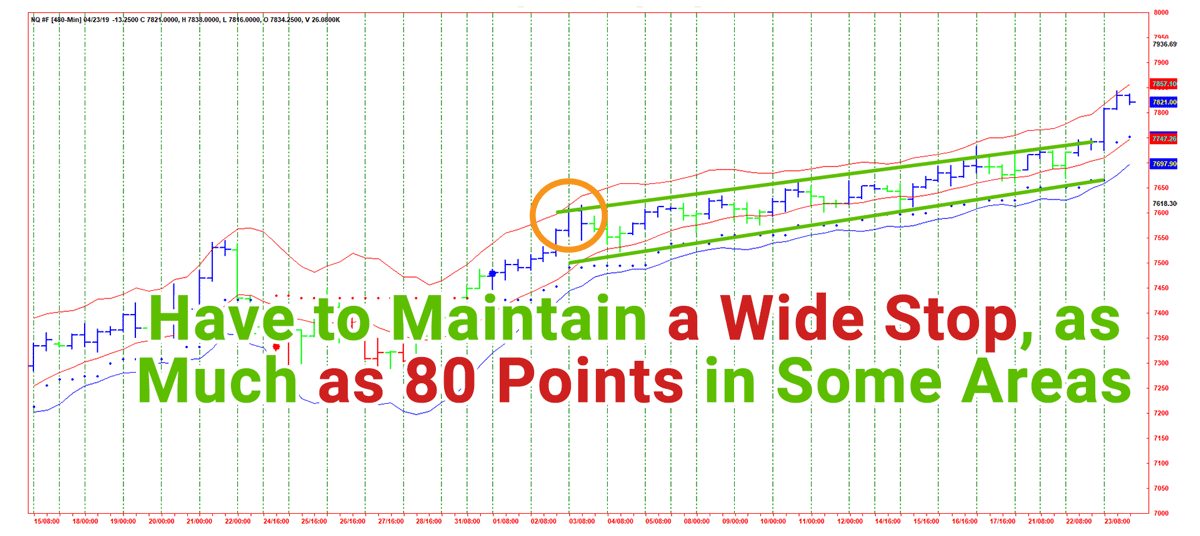
480-min NQ chart from 4/3 – 4/23
It can also trickier for new swing positions. Above, we have an NQ chart which shows the compressed volatility through April. You can see the immediate difference before & after prices broke 7,600. Between 7,300 and 7,600, prices shot up 300 points in just 1 week. That represents a $6k/contract trading opportunity.
Since then, it has taken 3 times as long to continue up the same amount. More importantly, because the price action hadn’t moved quickly, it was impossible to quickly secure profit because it would come right back. If you didn’t give enough room, you couldn’t hold the position to the end, as shown above. That’s tough for new positions because it would have required a stop that was 80 points below the price, or $1,600/contract risk. If you gave too little, you could be stopped & miss the move, as well as taking a loss.
So What’s Next?
We can get a clue from the broader market:
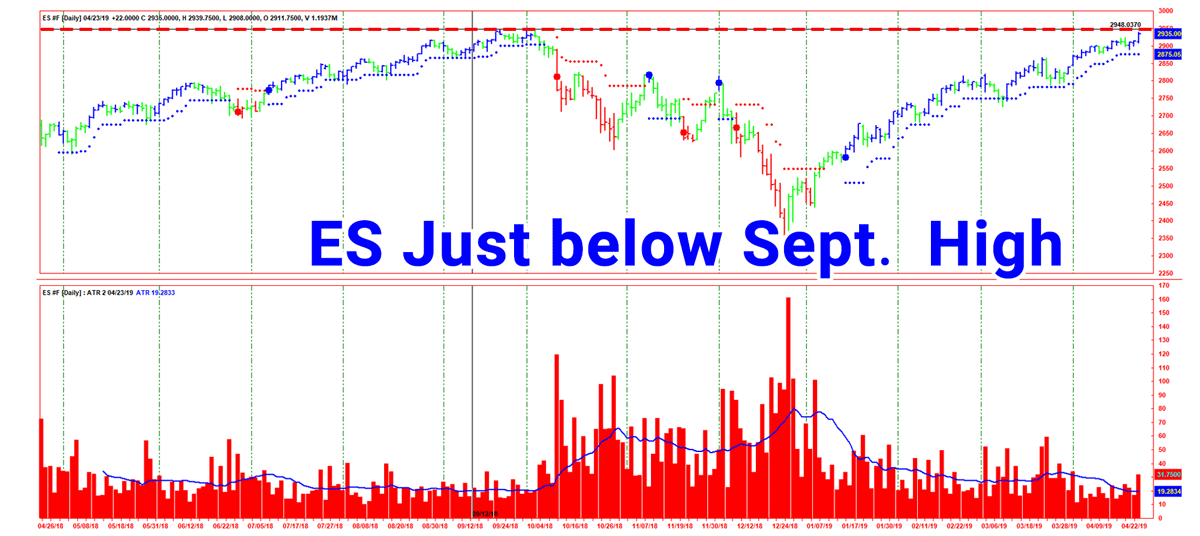
S&P 500 e-mini (ES) Daily Chart, 2018-2019
While the market is getting a boost from the Tech Sector, the broader market is still shy of new record highs. ES is trading just a few points off from it’s Sept 2018 highs. If prices could break to the upside in the broader market, it might serve as the trigger for the technical leg up. Some rapid price action would be just what traders need following the abysmal volatility in April.
Typically, what we want is an asymmetric risk/reward as well as an immediate, explosive move. Once the price action establishes support above our entry price, it’s easy to hold on to a big winner
We’ll be paying attention for strength overnight & into the weekend. Key Low: 2,914.25
The Counter Example
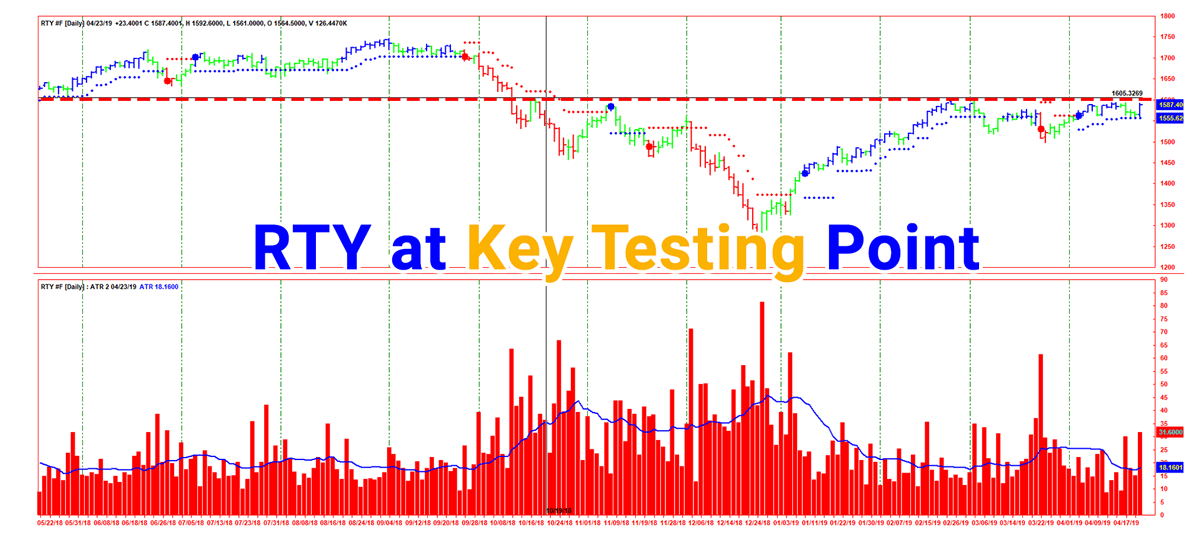
Russell 2000 e-mini (RTY), 2018-2019
Since we haven’t had the follow through in the broader market, there is still the possibility that we are observing a false breakout, that is centered around Tech. I would look to RTY for the signal on the downside. Small Caps had led on the way down in last year’s sell off, and they continue to lag behind in this year’s rally. If we see either ES or RTY start to slide, it can drag down the whole equity space including NQ.
At this point, it could still go either way, which should make the next few weeks pretty interesting. As volatility expands here, keep in mind that it could be temporary. Volatility may collapse again if prices resolve into a clear bull market. As this story unfolds, you’ll want to start think about what strategies you will use to generate alpha if we return to a low volatility regime as we had in 2013-2014.
Leave a Reply
You must be logged in to post a comment.