Swing Trading Concepts in 3 Current Examples
AAPL – Can we score again with the sweet spot?
A few weeks ago, Apple had traded up to it’s weekly resistance dots. Following a nearly 40% decline in Q4 last year, the stock traded up on earnings in January. This move higher was followed by an extended testing period, where the price action had basically flat lined. Fortunately, prices held above support, and even formed a sweet spot to trade up through the weekly resistance level.
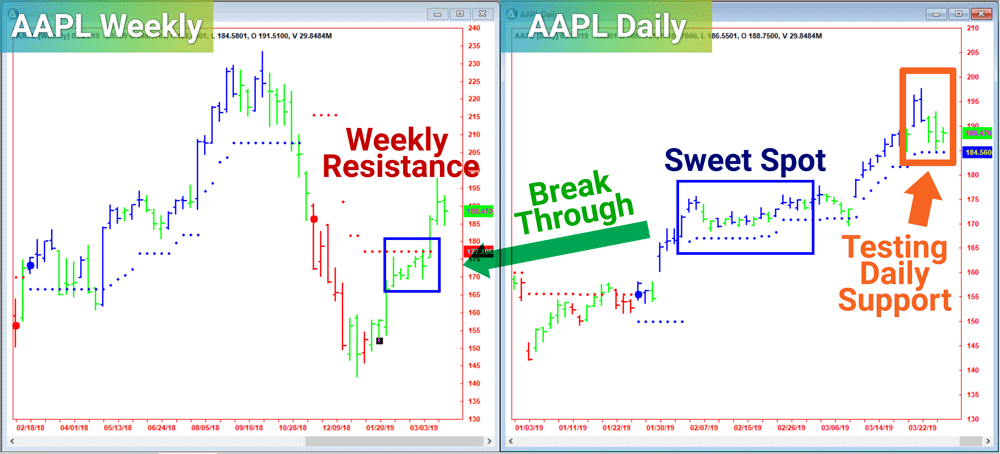 It is notable that prices first broke through the high, swung low for a retest before continuing up.
Apple is again trading at the daily support, so we will want to observe the 30-min signals for early buy signals. A potential roadblock for this trade to continue higher is the recent high at 197.69. If we were to have a long trade signal around 190, that would mean a potential 4% (7.69 points) open profit by the time prices go to retest highs. Depending on the amount of risk for such a trade setup, this could be a very favorable risk/reward trade setup.
AMZN – A step behind AAPL?
If this trade setup looks familiar, it’s because from the perspective of the signals, it’s the same trade setup that we saw in February for AAPL.
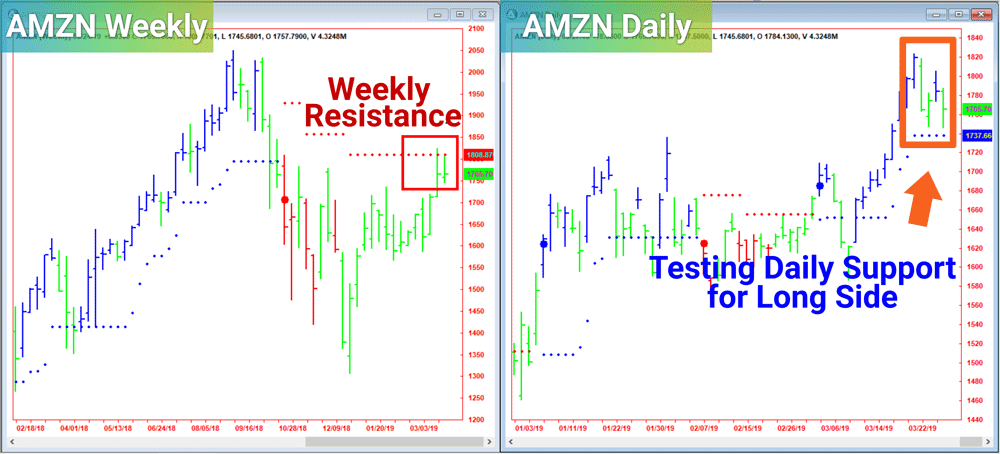 Is there a potential trade higher in AMZN?
This may end up being a tough trade to hold on to if this weekly resistance level holds for as long as it had in AAPL. If you are fortunate to be carrying a long position already, it makes this potentially turbulent much earlier to hang on to, if prices want to swing. New positions will want to be structured around the idea that there is a road block at +/- 1,800.
GS – Are Bank Stocks a Short on the Expectation of no more 2019 Rate Hikes?
We saw the stock trending higher leading into last week’s Fed day, even making a new 17-week high prior to news. It now seems that the market may have gotten ahead of itself, with a potential false breakout. The stock has taken out the lower end of the trading range, and is potentially looking to fill the gap from Q4 earnings.
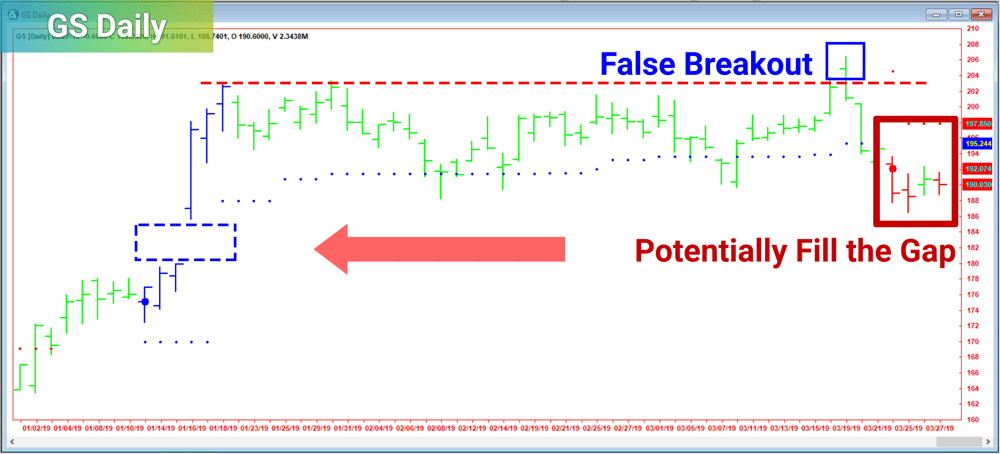
Currently the 30-min signal is long, and sandwiched between resistance dots on the 60-min and 120-min charts. If prices start lower, there may be a potential runner, otherwise the trade setup will look to find resistance at the daily dots.
Leave a Reply
You must be logged in to post a comment.