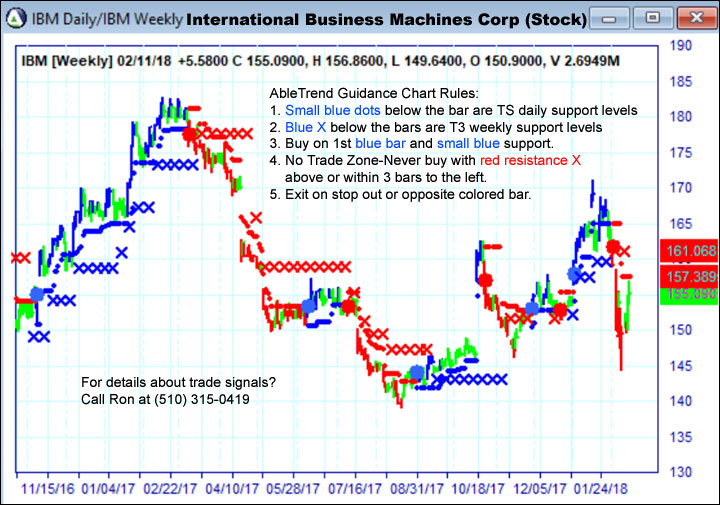
Stock Safety Measure For the High Volatility
Where to exit a trade to take profit or to cut lose is a big task for traders to act on. “If you know where to exit you can enter the market anytime.” Is there a safety measure that can help you to decide good entry and exits in a timely manner during the high volatile markets? Yes, that’s AbleTrend, and it can be tested for you to view the historical trades. Following are some examples of current trades.
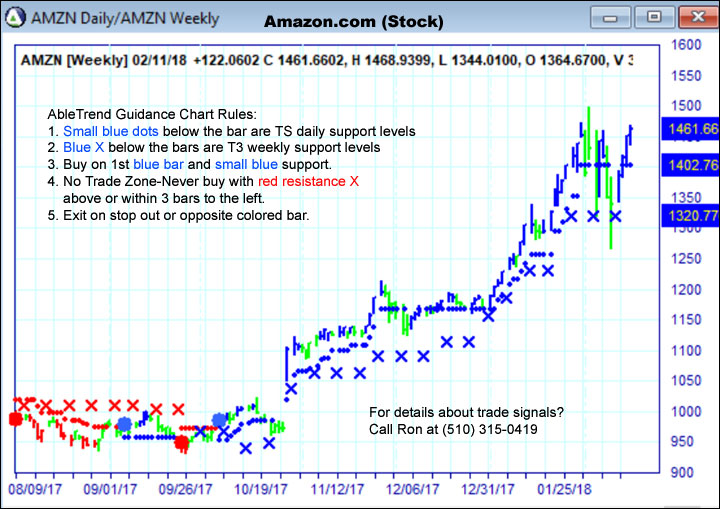
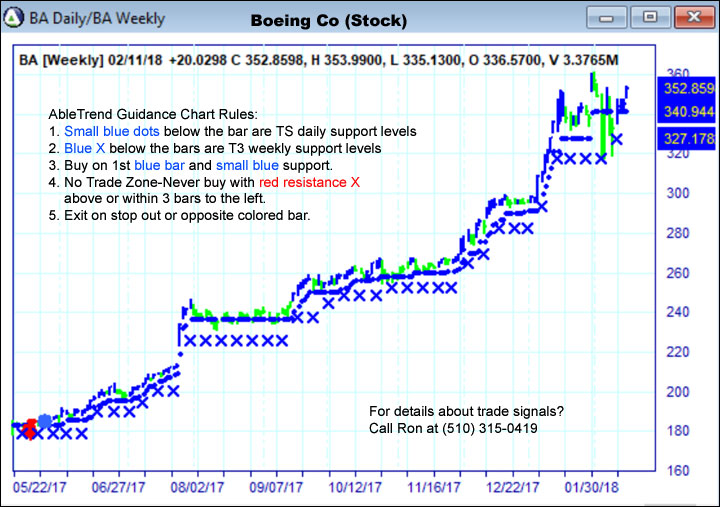
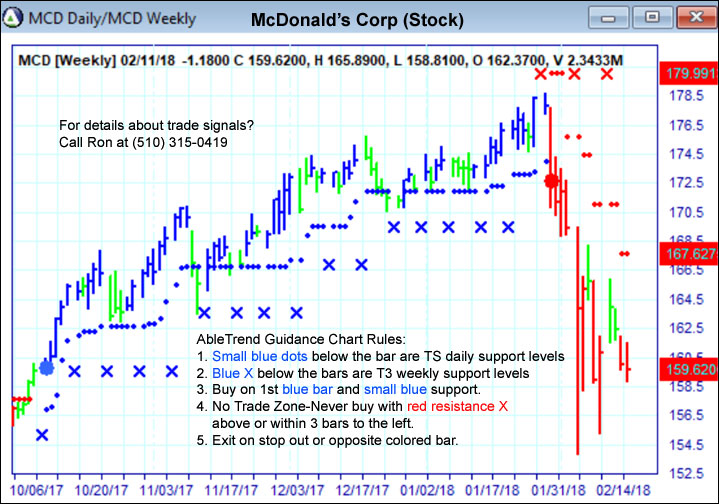
AbleTrend Guidance Chart Rules for Buy Position:
- Small blue dots below the bar are TS daily support levels;
- Blue X below the bars are weekly support levels;
- Buy when you see large blue dot, blue X and blue bar;
- Exit the market when you see the large red dot.
AbleTrend Guidance Chart Rules for Sell Position:
- Small red dots above the bars are TS daily resistance levels;
- Red X above the bars are T3 weekly resistance levels;
- Sell when you see red X, red bar and large red dot;
- Exit the market when you see large blue dot
You may learn more details about AbleTrend guidance chart with this Free 4-Day Mini-Course the Blueprint for Trading Success ($500 value. Limited offer.)
The best way to learn a skill is by practicing it. Through guides and tutorials, we will help you prepare for actual trading on the live market so you`ll know how your psychology will react to the experience. This insight is gained only through experience so give AbleTrend a try today.
As always, please feel free to forward this email to your friends.
With Warm Regards
AbleSys Corp.
Grace Wang
gracew@ablesys.com
Leave a Reply
You must be logged in to post a comment.