There are many WinTick hot stock picking lists which are mainly for what to trade. These lists are updated daily around 5 pm Pacific Time of the USA. Among these you should pay attentions to the first six of them as the following.
Let's explain each of the six lists, and how to trade them. All other lists are in "More" section. They are simple and straight forward.
Hot watch list for next 2 weeks gives stocks near by "sweet spots" which stocks are very close to weekly T2 key support / resistance, and Reward/Risk ratio is very high. See example charts below - the big blue or red dots are "Hot Watch" signals.
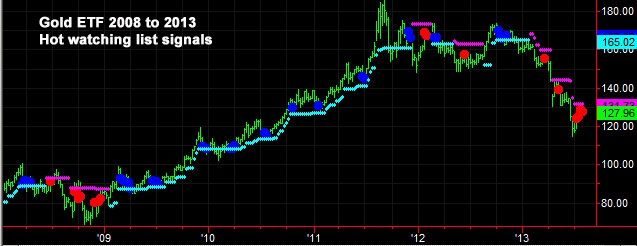
Example: GLD - Gold ETF weekly chart 2008 to 2013 with hot watch signals.
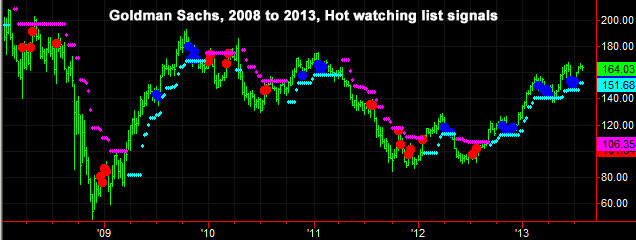
Example: Goldman Sachs weekly chart 2008 to 2013 with hot watch signals.
Picking these stocks is based on weekly charts (long term established trends). When you use AbleTrend AutoScan, select weekly chart. The stocks here are not ready to buy or sell yet, but their long trend is established, and just pulling near T2 level. It's safe to trade them when the price going back to the original trend direction. Good thing is the risk is very low, you know the trade right or wrong as soon as they test the T2 stops. When you trade, switch to short time interval - such as daily, 120- or 60-min charts. Only trade the long term established trend's direction.
These stocks must meet two criteria: (1) Natural percent gain (%) in the last 12 months must be way above average, in top 10% range; (2) Profit Factor or AbleSys Index must be way above average, in top 10% range. We only select the top 10 listed here for each group.
Therefore, these stocks are for long (buy) only. We simply use daily chart to AutoScan them. As long as the price not too close or above the red STARC band, we can buy and hold. Because the Profit Factor or AbleSys Index in the last 12 months are very good, we can 100% mechanically trade them. See an example chart below.
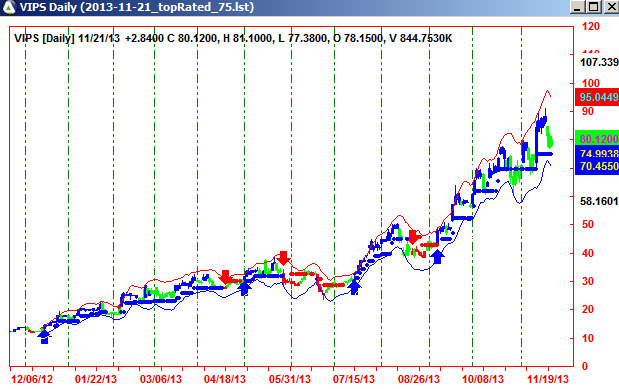
For example, this top rated stock was up from $10 to $80 in last 12 months, and the default buy/sell signals of AbleTrend are performed very well too. Here, "default" means using fixed AbleTrend pre-setup parameters without any curve fit.
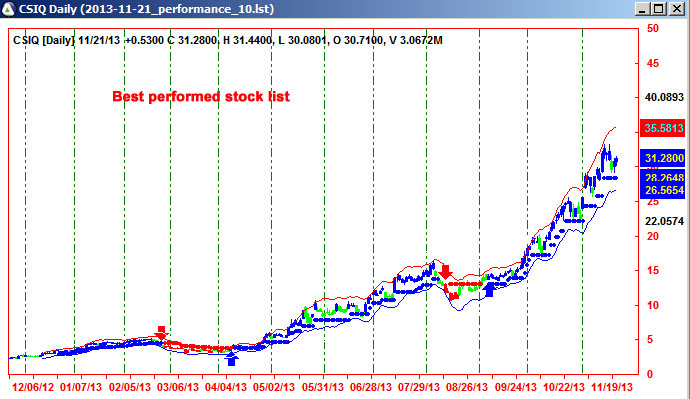
These stocks must meet one criteria: Profit Factor, or AbleSys Index, or % Net Gain of the AbleTrendTS 100% mechanical system must be way above average. We only select the top 10 listed here for each group.
Therefore, these stocks can traded for both long and short. We simply use daily chart with AbleTrendTS to AutoScan them. Because the Profit Factor or AbleSys Index in the last 12 months are very good, we can 100% mechanically trade the signals.
For example, below is one of the best performed stocks, which was up from $2 to $30 in last 12 months, and the default buy/sell signals of AbleTrend are performed very well too. Here, "default" means using fixed AbleTrend pre-setup parameters without any curve fit.
These stocks are selected because they are trigged with AbleTrendTS default signals. We only select the top 10 listed here for each group based on their AbleSys Index score.
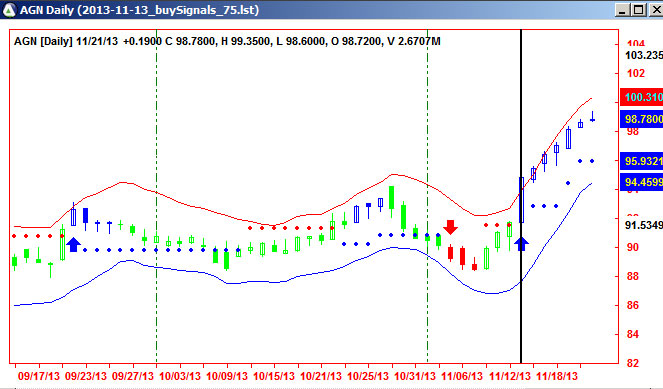
We use buy signal as an example. Basically, there is a buy signal today, we plan to buy when market opens tomorrow. The chance of winning cannot compete with the above two groups. The big blue arrow below the today's bar is your initial stop - tell you wrong or right. See one example below.
This example: the buy signal was trigged on 11/13/2013, and we review it one week later on 11/21/2013. Initial protection stop was about 90. Normally the signals can be used for swing trading in the next a few days.
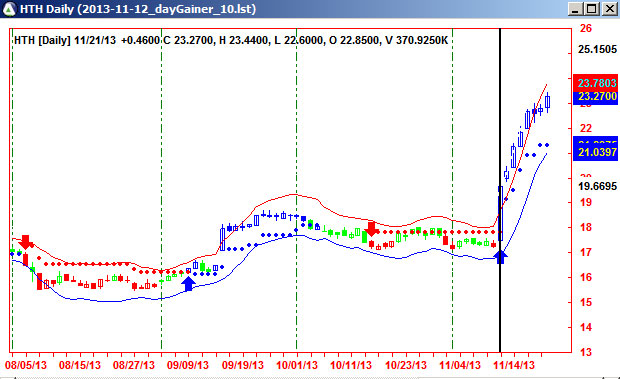
These stocks are selected because they had big percent gain today. We only select the top 10 listed here for each group based on the percent gain. A lot of the gainers had 10, 20, 30% or above gain. We only track the stock's gainers.
Why do we select such stocks? As we mentioned above selecting a stock to trade is like to select a beauty queen in beauty contest, as Warran Buffett said. It doesn't matter what you think. You must watch and see whom the most people like. The today's top gainers clearly met this criteria. The buyers are clearly in control. Normally the momentum is there, and up moving normally continues for a while. These are for swing trading of next a few days.
Below is an example of 11/12/2013. This stock was from $17 to $19.5, about 15% gain in a day. In the next a few day, the stock was up to $23.
These stocks are selected because they reached their 52-week high or low today.
Why do we select such stocks? We use "52-week high" to explain. As we mentioned above selecting a stock to trade is like to select a beauty queen in beauty contest, as Warran Buffett said. It doesn't matter what you think. You must watch and see whom the most people like. The 52-week high stocks today clearly met the criteria. Reaching 52-week high is milestone. The buyers are clearly in control. Normally the momentum is there, and up moving normally continues. Use AbleTrendTS or T2 to guide the trade. Watch out that you don't enter the buy position when the price is too close to the up STARC band. Leave room to go up.
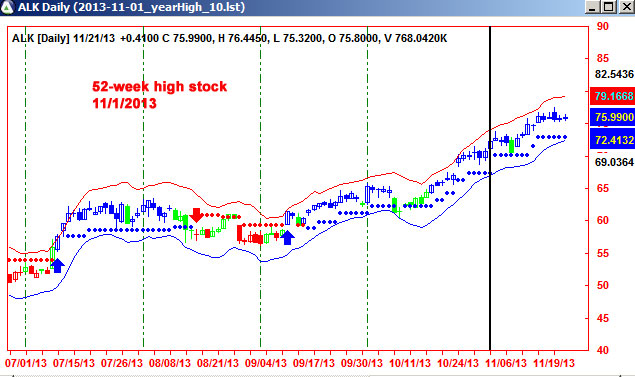
Above is an example of 11/1/2013. This stock kept reached 52-week highs in last two weeks, and price below STARC band at that time. It's clearly a good candidate to pick. We use AbleTrendTS or T2 with daily chart to guide our trades.
Important Disclaimer: Trading futures and foreign currency involves substantial risk and may not be suitable for all investors. Past performance is not necessarily indicative of future results. These results are based on simulated or hypothetical performance results that have certain inherent limitations. Unlike the results shown in an actual performance record, these results do not represent actual trading. Also, because these trades have not actually been executed, these results may have under-or over-compensated for the impact, if any, of certain market factors, such as lack of liquidity. Simulated or hypothetical trading programs in general are also subject to the fact that they are designed with the benefit of hindsight. No representation is being made that any account will or is likely to achieve profits or losses similar to these being shown. The testimonial may not be representative of the experience of other clients and the testimonial is no guarantee of future performance or success.
Risk Disclosure: Futures and options trading contains substantial risk and is not for every investor. An investor could potentially lose all or more than the initial investment. Risk capital is money that can be lost without jeopardizing one's financial security or lifestyle. Only risk capital should be used for trading and only those with sufficient risk capital should consider trading. Past performance is not necessarily indicative of future results.
Hypothetical Performance Disclosure: Hypothetical performance results have many inherent limitations, some of which are described below. no representation is being made that any account will or is likely to achieve profits or losses similar to those shown; in fact, there are frequently sharp differences between hypothetical performance results and the actual results subsequently achieved by any particular trading program. One of the limitations of hypothetical performance results is that they are generally prepared with the benefit of hindsight. In addition, hypothetical trading does not involve financial risk, and no hypothetical trading record can completely account for the impact of financial risk of actual trading. for example, the ability to withstand losses or to adhere to a particular trading program in spite of trading losses are material points which can also adversely affect actual trading results. There are numerous other factors related to the markets in general or to the implementation of any specific trading program which cannot be fully accounted for in the preparation of hypothetical performance results and all which can adversely affect trading results.
Testimonial Disclosure: Testimonials appearing on this website may not be representative of the experience of other clients or customers and is not a guarantee of future performance or success.
© Copyright 1995-2026 AbleSys Corporation. All rights reserved.
Privacy Statement
Address: 35111F Newark Blvd. Suite 506, Newark, CA 94560


