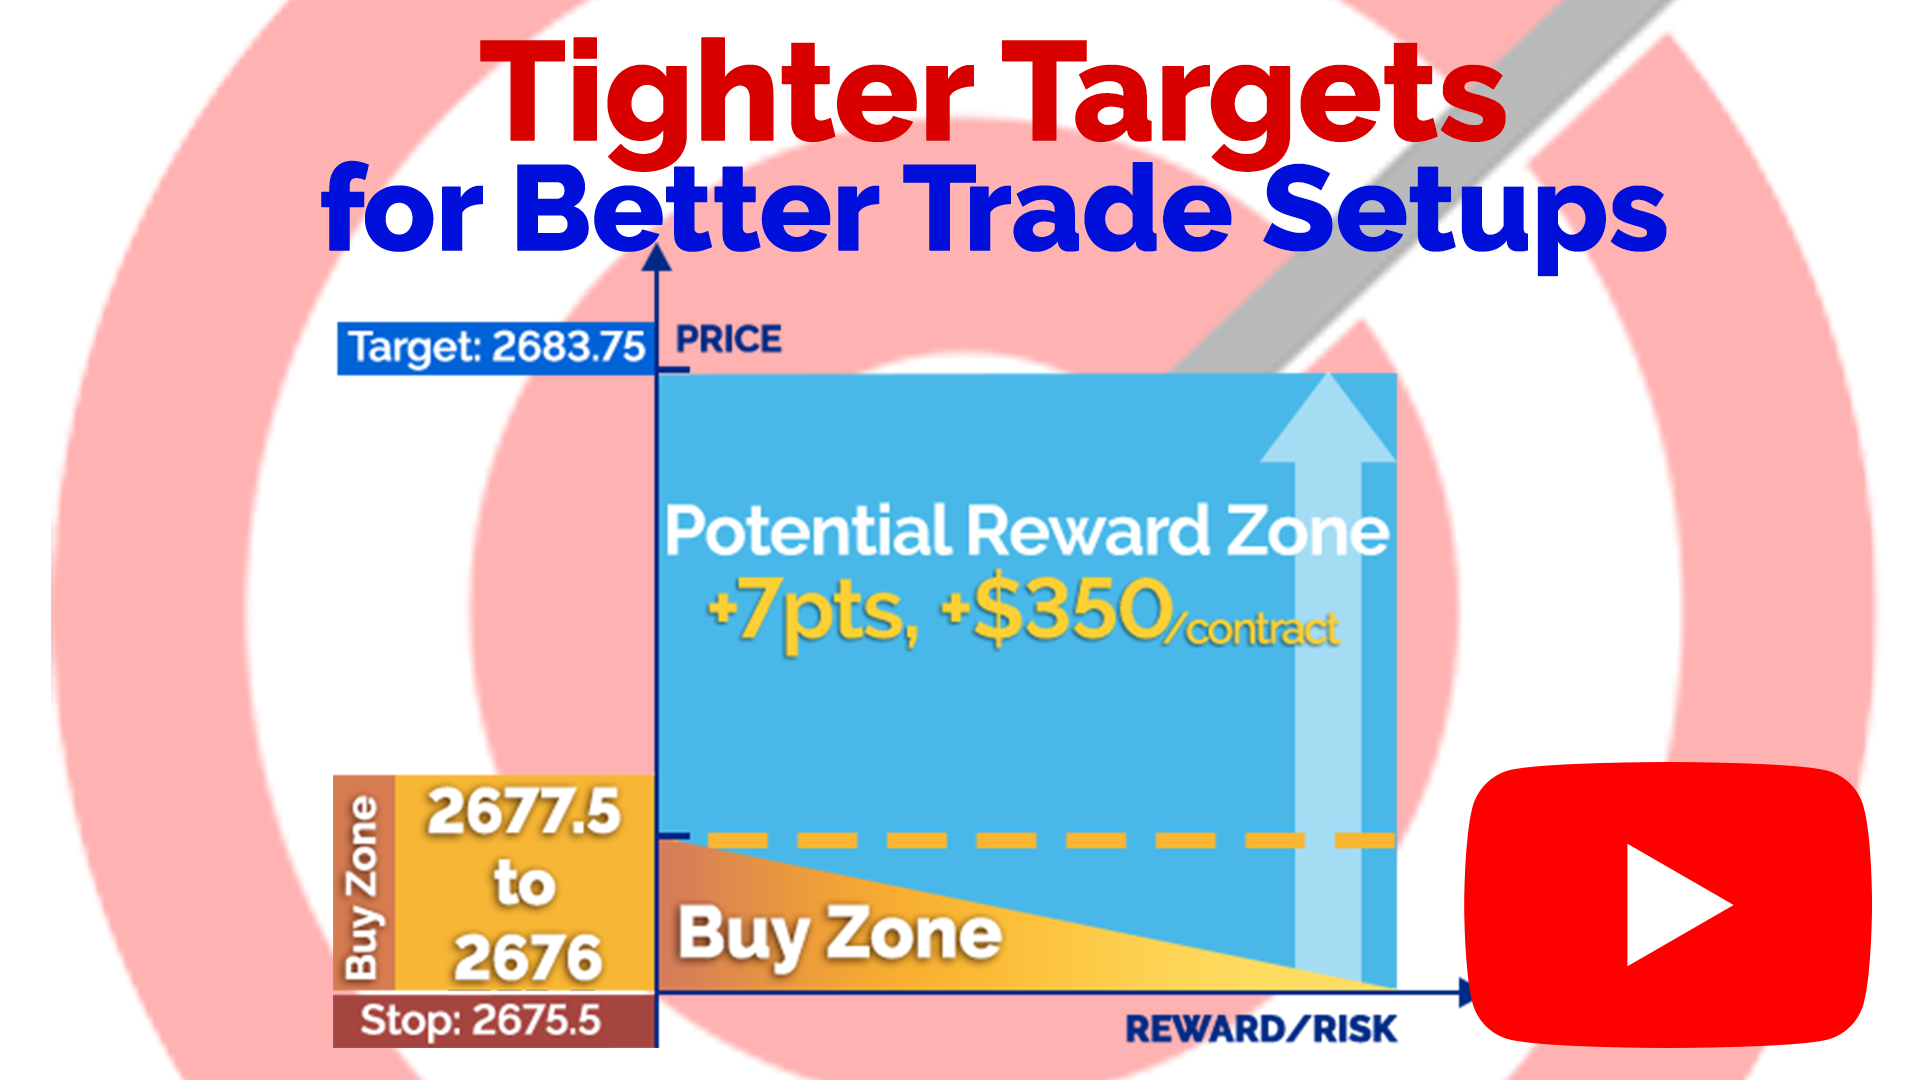
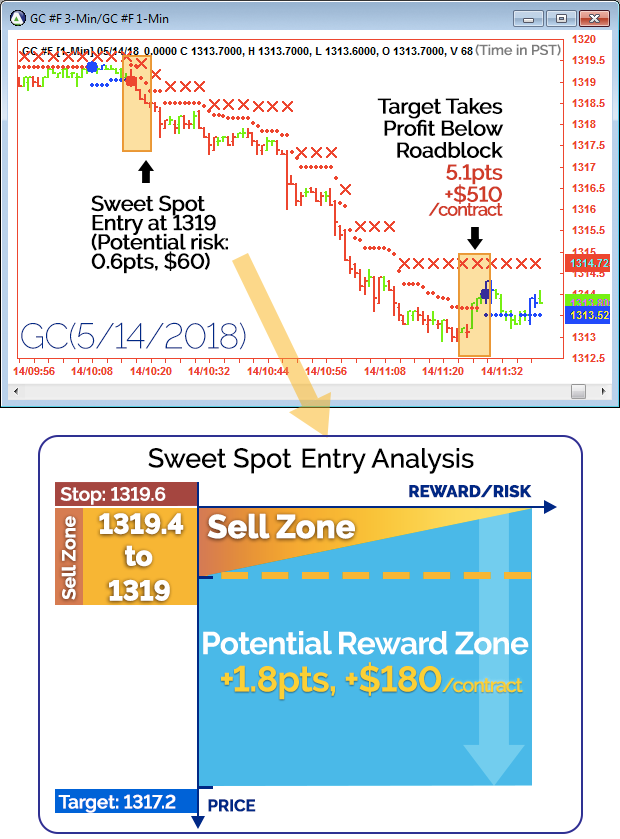
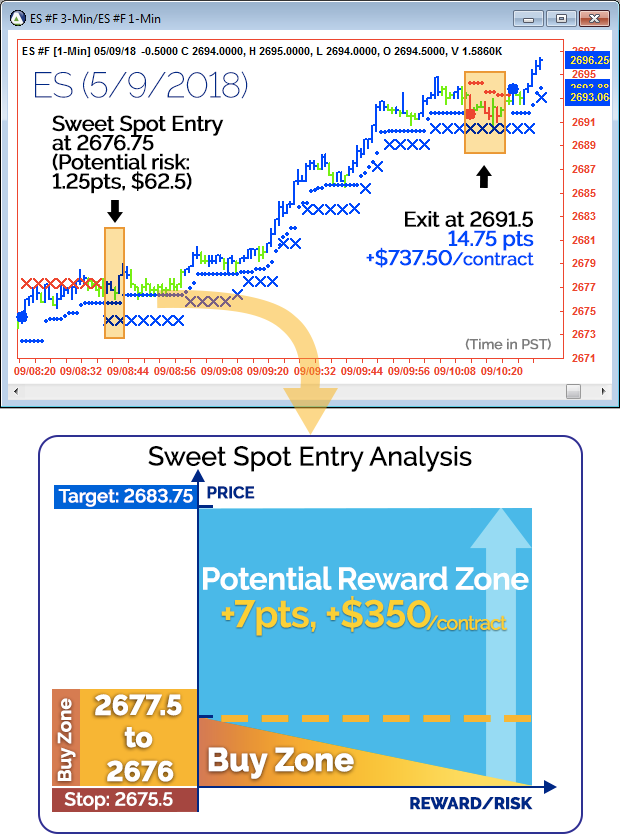
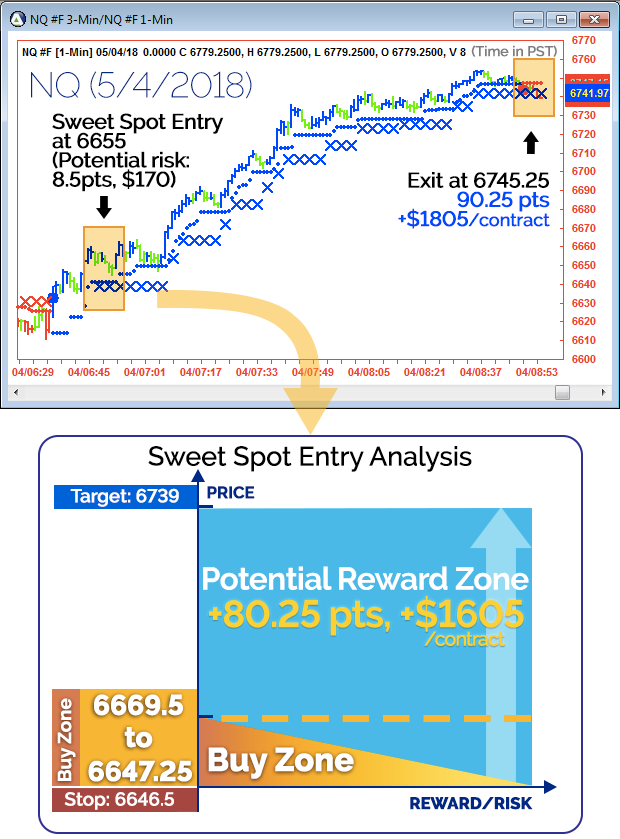
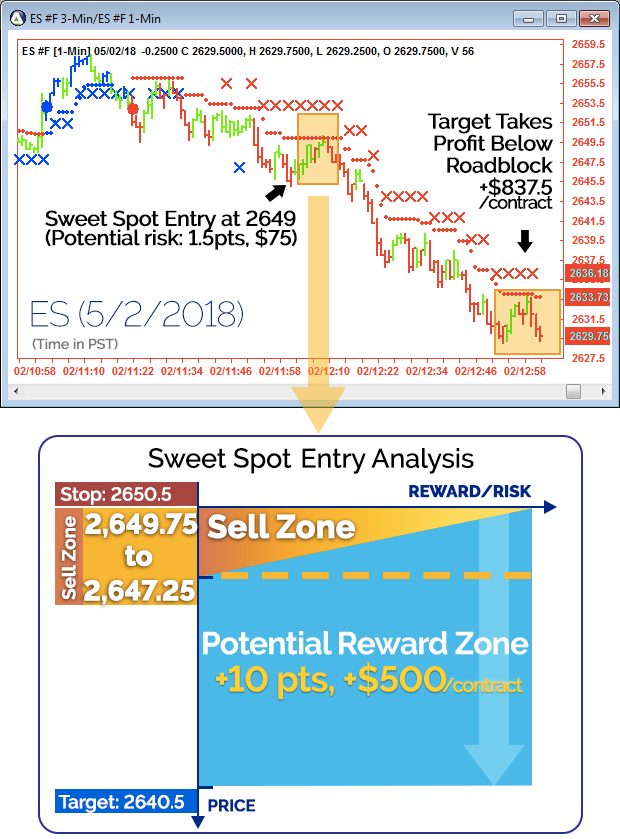
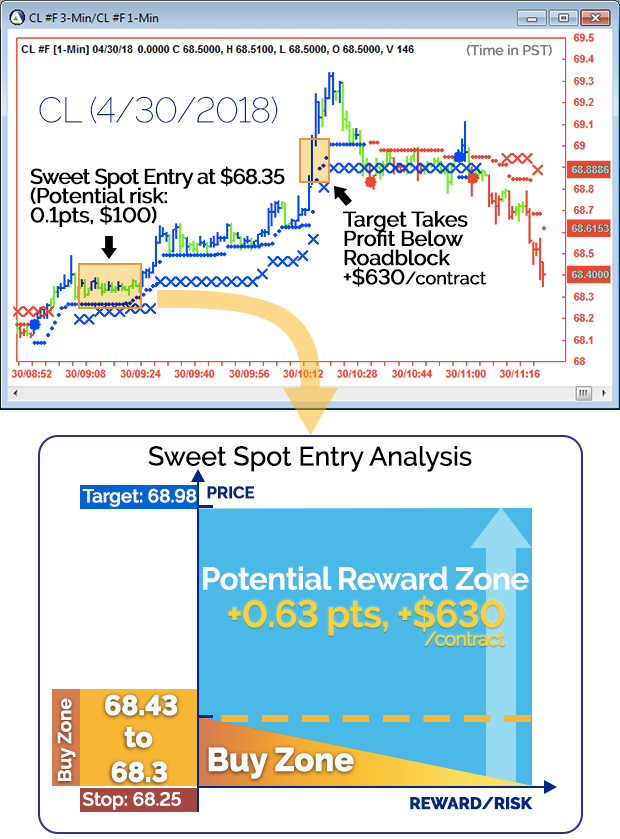
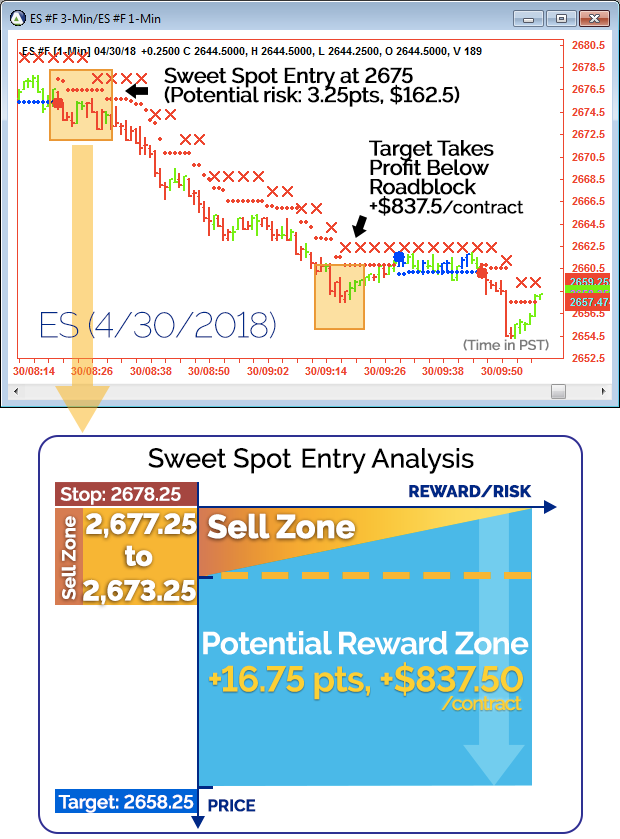
Featured charts have been prepared to demonstrate the key advantages to using AbleTrend. Session overviews show the winners and the losers so you can see how Signals generate big winners while keeping losses small.

The advantage is easy to see after the fact, but what about in the moment of the trade?
This library is provided to show you what you could have known, as the trade was setting up.
Risk Disclosure: Futures and options trading contains substantial risk and is not for every investor. An investor could potentially lose all or more than the initial investment. Risk capital is money that can be lost without jeopardizing one's financial security or lifestyle. Only risk capital should be used for trading and only those with sufficient risk capital should consider trading. Past performance is not necessarily indicative of future results.
Hypothetical Performance Disclosure: Hypothetical performance results have many inherent limitations, some of which are described below. no representation is being made that any account will or is likely to achieve profits or losses similar to those shown; in fact, there are frequently sharp differences between hypothetical performance results and the actual results subsequently achieved by any particular trading program. One of the limitations of hypothetical performance results is that they are generally prepared with the benefit of hindsight. In addition, hypothetical trading does not involve financial risk, and no hypothetical trading record can completely account for the impact of financial risk of actual trading. for example, the ability to withstand losses or to adhere to a particular trading program in spite of trading losses are material points which can also adversely affect actual trading results. There are numerous other factors related to the markets in general or to the implementation of any specific trading program which cannot be fully accounted for in the preparation of hypothetical performance results and all which can adversely affect trading results.
Testimonial Disclosure: Testimonials appearing on this website may not be representative of the experience of other clients or customers and is not a guarantee of future performance or success.
© Copyright 1995-2026 AbleSys Corporation. All rights reserved.
Privacy Statement
Address: 35111F Newark Blvd. Suite 506, Newark, CA 94560


