The elusive sweet spot is the secret to finding great trade setups that can win big.
Wintick Systematically Finds Trade Setups Like This
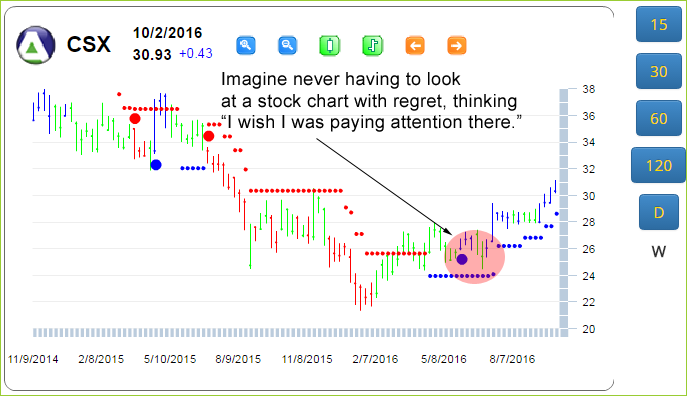
Here we can see a classic sweet spot that showed up on our list after Brexit toward the end of June.
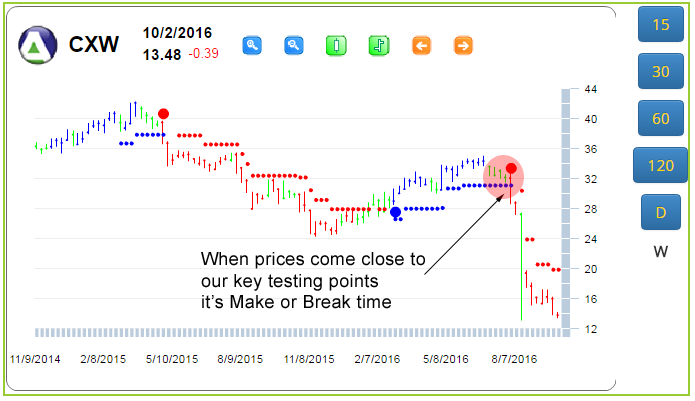
What's the biggest risk in investing? Not having an exit strategy. Wintick begins with the exit strategy, and is based on identifying key testing points where stocks are in make or break territory.
That means the trade setup is either validated by a big gain, or it is quickly invalidated for a clear and manageable loss.
Compare this to the opposite when you've been strung along by your investments & you're told to endure "short term pain for long term gain".
Sweet Spot stocks are ones that should go now, or we don't want them at all & if we get a break in the accompanying stop, we can exit with confidence.

Wintick was created with AbleSys trading systems, rigorously vetted by active day traders and futures traders to trade the markets for over 20 years.
Since 1997, AbleTrend has been chosen by the readers of Stocks & Commodities magazine in their yearly Reader's Choice Awards.
And now, you can use the same edge to manage your positions and investments too! Try Wintick for yourself, free for 7 days.
Risk Disclosure: Futures and options trading contains substantial risk and is not for every investor. An investor could potentially lose all or more than the initial investment. Risk capital is money that can be lost without jeopardizing one's financial security or lifestyle. Only risk capital should be used for trading and only those with sufficient risk capital should consider trading. Past performance is not necessarily indicative of future results.
Hypothetical Performance Disclosure: Hypothetical performance results have many inherent limitations, some of which are described below. no representation is being made that any account will or is likely to achieve profits or losses similar to those shown; in fact, there are frequently sharp differences between hypothetical performance results and the actual results subsequently achieved by any particular trading program. One of the limitations of hypothetical performance results is that they are generally prepared with the benefit of hindsight. In addition, hypothetical trading does not involve financial risk, and no hypothetical trading record can completely account for the impact of financial risk of actual trading. for example, the ability to withstand losses or to adhere to a particular trading program in spite of trading losses are material points which can also adversely affect actual trading results. There are numerous other factors related to the markets in general or to the implementation of any specific trading program which cannot be fully accounted for in the preparation of hypothetical performance results and all which can adversely affect trading results.
Testimonial Disclosure: Testimonials appearing on this website may not be representative of the experience of other clients or customers and is not a guarantee of future performance or success.
© Copyright 1995-2026 AbleSys Corporation. All rights reserved.
Privacy Statement
Address: 35111F Newark Blvd. Suite 506, Newark, CA 94560


