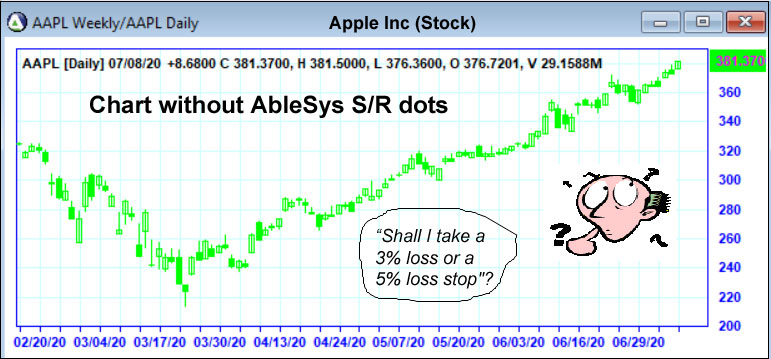
You have entered a market and are holding a position. But now the market is moving against you. Is this current move a retracement or a reversal? If it is a retracement, it is a temporary pullback, where prices will bounce off support and resume the direction of the original trend. If it is a reversal, prices will break through the support level and continue to move against the original trend. Retracement or reversal? It is a typical question that traders face every day. You wonder:
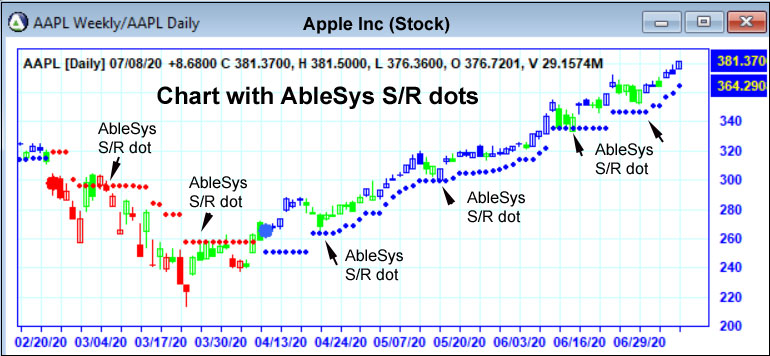
Yes, #6 is the most important question! If you knew the true market support levels, you could use them to test market strength. When a market tests the support level, if it cannot penetrate that level but instead resumes the anticipated trend, that movement more likely is just a retracement. If you wanted, you could even add to your position at that time. On the other hand, if the market penetrates the support level and closes beyond it, it is likely a reversal. You would do well to exit the position and cut your losses short. Identifying an objective support level is the key to determining if the current move is a retracement or a reversal. So now we ask, is there a way to identify objective support levels?
The answer is Yes! AbleSys support dots provide objective support levels by blue dots placed below the price bars; AbleSys resistance dots provide objective resistance levels by red dots placed above the price bars, so that well defined S/R levels are at your fingertips. AbleSys S/R dots offer the following advantages:
With the help of AbleSys S/R dots you can now:
The market is always changing, but the way AbleTrend works remains unchanged. Once you see it work time and time again, you will know that you can rely on it and utilize it. That is the value of the legendary AbleTrend S/R dots. The method is timeless. AbleTrend can help you thrive in today’s volatile markets.
Risk Disclosure: Futures and options trading contains substantial risk and is not for every investor. An investor could potentially lose all or more than the initial investment. Risk capital is money that can be lost without jeopardizing one's financial security or lifestyle. Only risk capital should be used for trading and only those with sufficient risk capital should consider trading. Past performance is not necessarily indicative of future results.
Hypothetical Performance Disclosure: Hypothetical performance results have many inherent limitations, some of which are described below. no representation is being made that any account will or is likely to achieve profits or losses similar to those shown; in fact, there are frequently sharp differences between hypothetical performance results and the actual results subsequently achieved by any particular trading program. One of the limitations of hypothetical performance results is that they are generally prepared with the benefit of hindsight. In addition, hypothetical trading does not involve financial risk, and no hypothetical trading record can completely account for the impact of financial risk of actual trading. for example, the ability to withstand losses or to adhere to a particular trading program in spite of trading losses are material points which can also adversely affect actual trading results. There are numerous other factors related to the markets in general or to the implementation of any specific trading program which cannot be fully accounted for in the preparation of hypothetical performance results and all which can adversely affect trading results.
Testimonial Disclosure: Testimonials appearing on this website may not be representative of the experience of other clients or customers and is not a guarantee of future performance or success.
© Copyright 1995-2026 AbleSys Corporation. All rights reserved.
Privacy Statement
Address: 35111F Newark Blvd. Suite 506, Newark, CA 94560


