

Two AI Powerhouses: CRWD’s Next Leg Up & SOXX Testing Support
November 19, 2026 AbleSys team
In a volatile market, the most dangerous thing a trader can do is act on emotion. When high-flying tech and semiconductor stocks pull back, you need an objective, rule-based system to tell you the difference between a healthy dip and a broken trend.
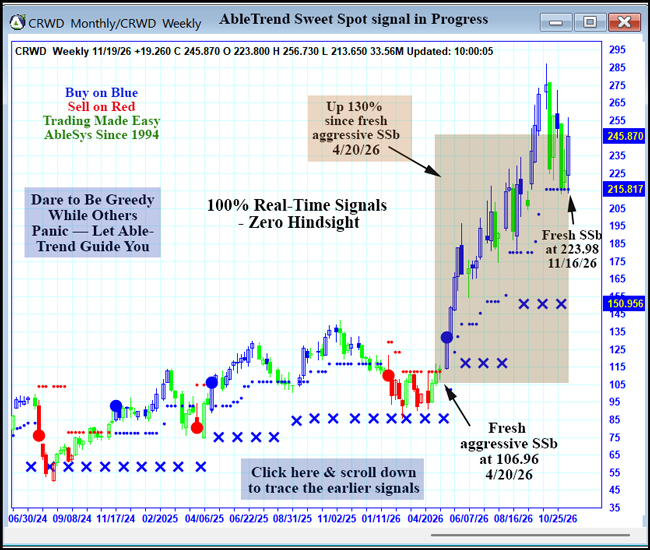
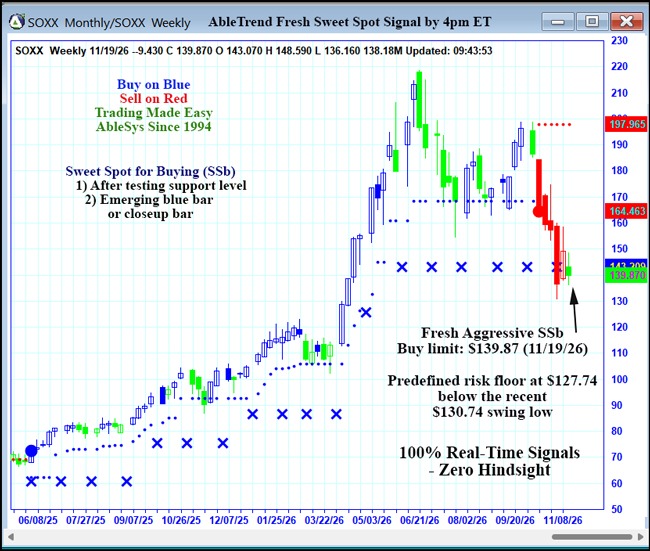
Today’s charts of CrowdStrike (CRWD) and the iShares Semiconductor ETF (SOXX) show exactly how AbleTrend removes the guesswork—capturing massive long-term trends while pinpointing low-risk, predefined entry points along the way.
How to Read These Charts in 15 Seconds
If you are new to AbleTrend, here is a quick guide to our visual signals:
- Blue Bars = Confirmed Uptrend
- Red Bars = Confirmed Downtrend
- Green Bars = Transition / Bounce
- Row of Blue X’s = Major Support Floor (the line in the sand that keeps the big-picture trend intact)
- Sweet Spot for Buying (SSb) = A high-probability setup where price tests major support and stabilizes, allowing you to enter with a tight, predefined stop just below the support floor.
Chart 1: CrowdStrike (CRWD) — The Power of Riding the Trend
The Technical Setup: Take a look at the historical context on this CRWD chart. AbleTrend issued a Fresh Aggressive SSb way back on April 20, 2026, at $106.96. By simply following the blue bars and trailing support dots, AbleTrend users were guided to stay in the trade for a massive 130% gain. Now, after a recent pullback, CRWD has printed a brand new Fresh SSb signal at $223.98, with the weekly support dots sitting right below at $215.81.
The Fundamental Backdrop: CrowdStrike remains a dominant force in cybersecurity. The company recently reported a 25% surge in annual recurring revenue (ARR) to $5.84 billion, with net new ARR jumping 51% to a record $333 million. As enterprises rapidly expand their digital infrastructure and deploy autonomous AI agents, cybersecurity spending is accelerating. CrowdStrike’s recent acquisitions of AI security startups further cement its platform as a must-have for modern data centers, providing a strong fundamental tailwind for this new technical entry.
Chart 2: iShares Semiconductor ETF (SOXX) — Testing Major Support
The Technical Setup: SOXX, which tracks the broader semiconductor sector, has experienced a steep multi-week pullback from its highs. While price has temporarily pierced the Monthly Blue X zone, AbleTrend flags a Fresh Aggressive SSb with an entry at $139.87. To trade this setup safely, traders can anchor their predefined risk floor at $127.74—placing their stop safely below the recent swing low of $130.74 to avoid getting chopped out by intraday volatility.
The Fundamental Backdrop: Semiconductors are the physical backbone of the global AI buildout. While the sector has recently cooled off due to high baseline valuations and shifting government export policies, the underlying demand for AI compute power remains robust. By trading the SOXX ETF at established technical support rather than chasing individual chip stocks at their peaks, you gain diversified exposure to the foundational hardware of the AI revolution at a discounted, risk-defined entry point.
100% Real-Time Signals — Zero Hindsight
Every signal shown on these charts is calculated 100% in real-time at the close of the bar. AbleTrend signals never repaint or shift after the fact. When you know your exact entry price and your exact support floor before you place a trade, you trade with discipline, not emotion.
Want to see real-time AbleTrend Sweet Spot signals and exact support levels on your own watchlist? Start your AbleTrend trial today at WinTick.com.
Disclosure: AbleSys, its officers, or affiliated accounts currently hold positions in some of the Sweet Spot (SSb) securities shown in our charts, and may buy or sell shares at any time based on AbleTrend signals. All chart examples are provided strictly for educational and informational purposes and do not constitute personalized investment advice. Trading stocks, options, and futures involves substantial risk of loss.


