

Fresh Buy Signals: Gold (GLD) and the S&P 500 (SPY)
November 10, 2026 AbleSys team
Fundamental analysis identifies WHAT assets have strong long-term value, but our visual charts tell you EXACTLY WHEN to enter with minimal risk. Today, two cornerstone assets have triggered brand-new buy signals at major support levels: SPDR Gold Shares (GLD) and the S&P 500 ETF (SPY).
The Fundamentals: Why GLD and SPY?
Gold continues to see historic structural support, driven by aggressive official reserve accumulation from global central banks and accelerating demand for physical gold ETFs as a macro hedge.
At the same time, the broader U.S. economy remains anchored by corporate earnings strength. For Q3, S&P 500 companies delivered over 30% year-over-year earnings growth, with more than 80% of companies exceeding consensus earnings expectations.
The Charts: Understanding the "Sweet Spot" Entry
Even in strong bull markets, buying during pullbacks can feel intimidating without objective rules. If you are new to our charts, our approach is built on a simple color-coded discipline: Buy on Blue, Sell on Red.
We specifically seek out high-probability setups known as the "Sweet Spot for Buying" (SSb). A Sweet Spot signal is confirmed when two conditions are met:
- The price tests a verified institutional support level (marked by the blue X's or blue dots on our charts).
- The price then prints a fresh blue bar, confirming that buyers have absorbed the selling pressure and a new upward move is beginning.
When an entry signal prints right as price rebounds off deep major support, it forms an "Aggressive Sweet Spot" — designed for traders looking to step in early with a well-defined floor.
GLD Weekly Chart
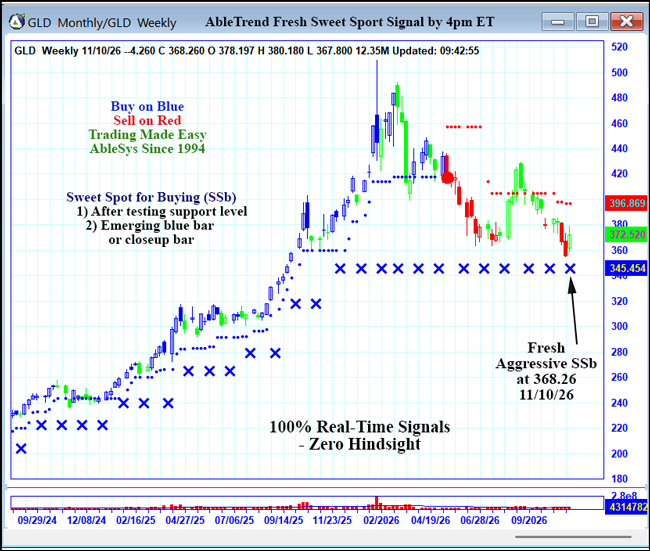
After pulling back from its peak, GLD retraced cleanly to test its long-term monthly support zone (the blue X's near 345). Today, it triggered a Fresh Aggressive Sweet Spot buy signal at 368.26. With the bar turning blue right off this major floor, buyers are stepping in early to capitalize on the next upward leg with defined risk.
SPY Weekly Chart
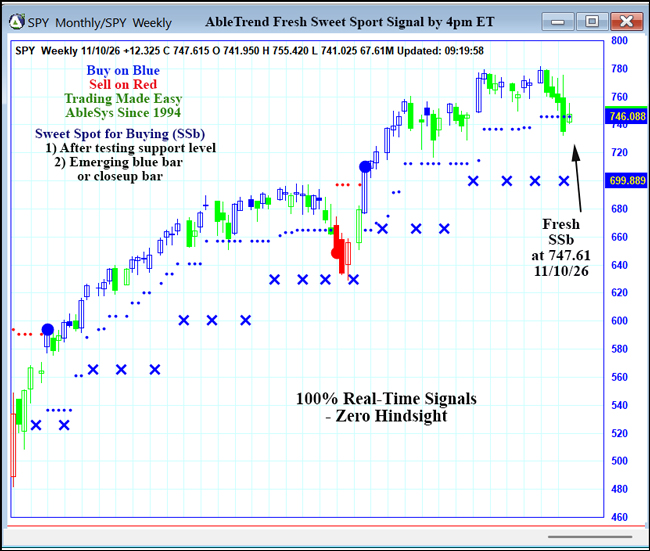
The benchmark S&P 500 ETF (SPY) has absorbed recent short-term market consolidation and held above its multi-month support floor. SPY has just printed a fresh blue bar at 747.61, confirming a Sweet Spot for Buying (SSb). This indicates that the dip has been bought and the broader market trend remains pointed upward.
Our charts provide 100% real-time, objective signals with zero hindsight, taking the emotion and guesswork out of market timing.
Disclosure: We hold some of the SSb stocks our charts are showing.


